
Devirtualizing Themida's (Code Virtualizer) FALCON VM to readable code
Intro
This article is written in a journey like manner, it’s not a guide, nor is it a proper research paper. I have actually reverse engineered plenty of ~ software ~ utilizing Themida, Code Virtualizer by Oreans, and VMProtect before; then I took a break, and now this is my first attempt to document the architecture, its artifacts, and try to automatically optimize it. The goal is to essentially ‘recompile’ the binary in a much more readable format, and for that, the VM design should be well researched and understood.
Intentions
This post is not intending to cast any negative views upon Oreans and Themida and Code Virtualizer in particular, the creator(s) of said software or anyone who uses it. I admire the creator(s) who clearly have impressive skills to create such a product. This post has also been created under the impression that everything discussed here has most likely been discovered by private entities, and that I am not the first to find or document such things about the Themida’s FALCON VM architecture. I am not intending to present this information as though it is ground breaking or something that no one else has already discovered, quite the opposite. This is simply a collection of existing information appended with my own research.
Challenge
Although there are many great tools that help in reverse engineering of obfuscated binaries, I decided to do the following analysis in the most manual way possible. Why? Because there is already a lot of research on lifting VM traces and optimizing them. Tools such as Remill and Triton are awesome, and I use them all the time for more complex analysis. However, for this particular task, we’ll limit ourselves to the following:
- Unicorn (https://github.com/unicorn-engine/unicorn/). To trace VM stubs
- IDA (not necessarily PRO) or any other disassembler
Sample
For this journey, I compiled a simple C++ console app that takes a string input, does some cryptography, and then returns the hash. The sample was virtualized with FALCON_TINY_VM, the latest released VM. The falcon VM is designed to be fast and have low complexity.
Backbone
In every virtual machine, there’s a backbone - a place where all the data about execution state lives. We usually call it the context. Every VM has it in one form or another, simply because we can’t just “start executing code” with no state.
Knowing that, I decided to start with vm context identification and go from there. Obviously, all VMs are different and so are their VM contexts but let’s identify the parts that must be present in any context:
- Host’s registers that are used by the VM. Usually, it’s all general-purpose registers, but it’s worth noting that it’s not guaranteed (some registers may purposefully be left unused by the VM).
- RFLAGS. Unlike registers, a VM can’t just not use flags. All bitwise operations affect it, meaning if such operations are performed by the VM (which they are), the RFLAGS value would change.
- Virtual stack pointer (VSP). The same as RSP but for the virtual stack. All stack manipulations made by the VM are recorded here.
- Virtual instruction pointer (VIP). A pointer to the current virtual instruction opcode and its data, similar to RIP. However, it’s worth noting that in modern VMs, it’s unlikely that you’ll find a decodable static opcode. Nowadays, the VIP is mainly used for data fetching (e.g., when a call should be made or a pointer read/written), and there’s no single dispatcher that interprets the code.
- To start things off, let’s navigate to our virtualized function. In my sample, it’s main.
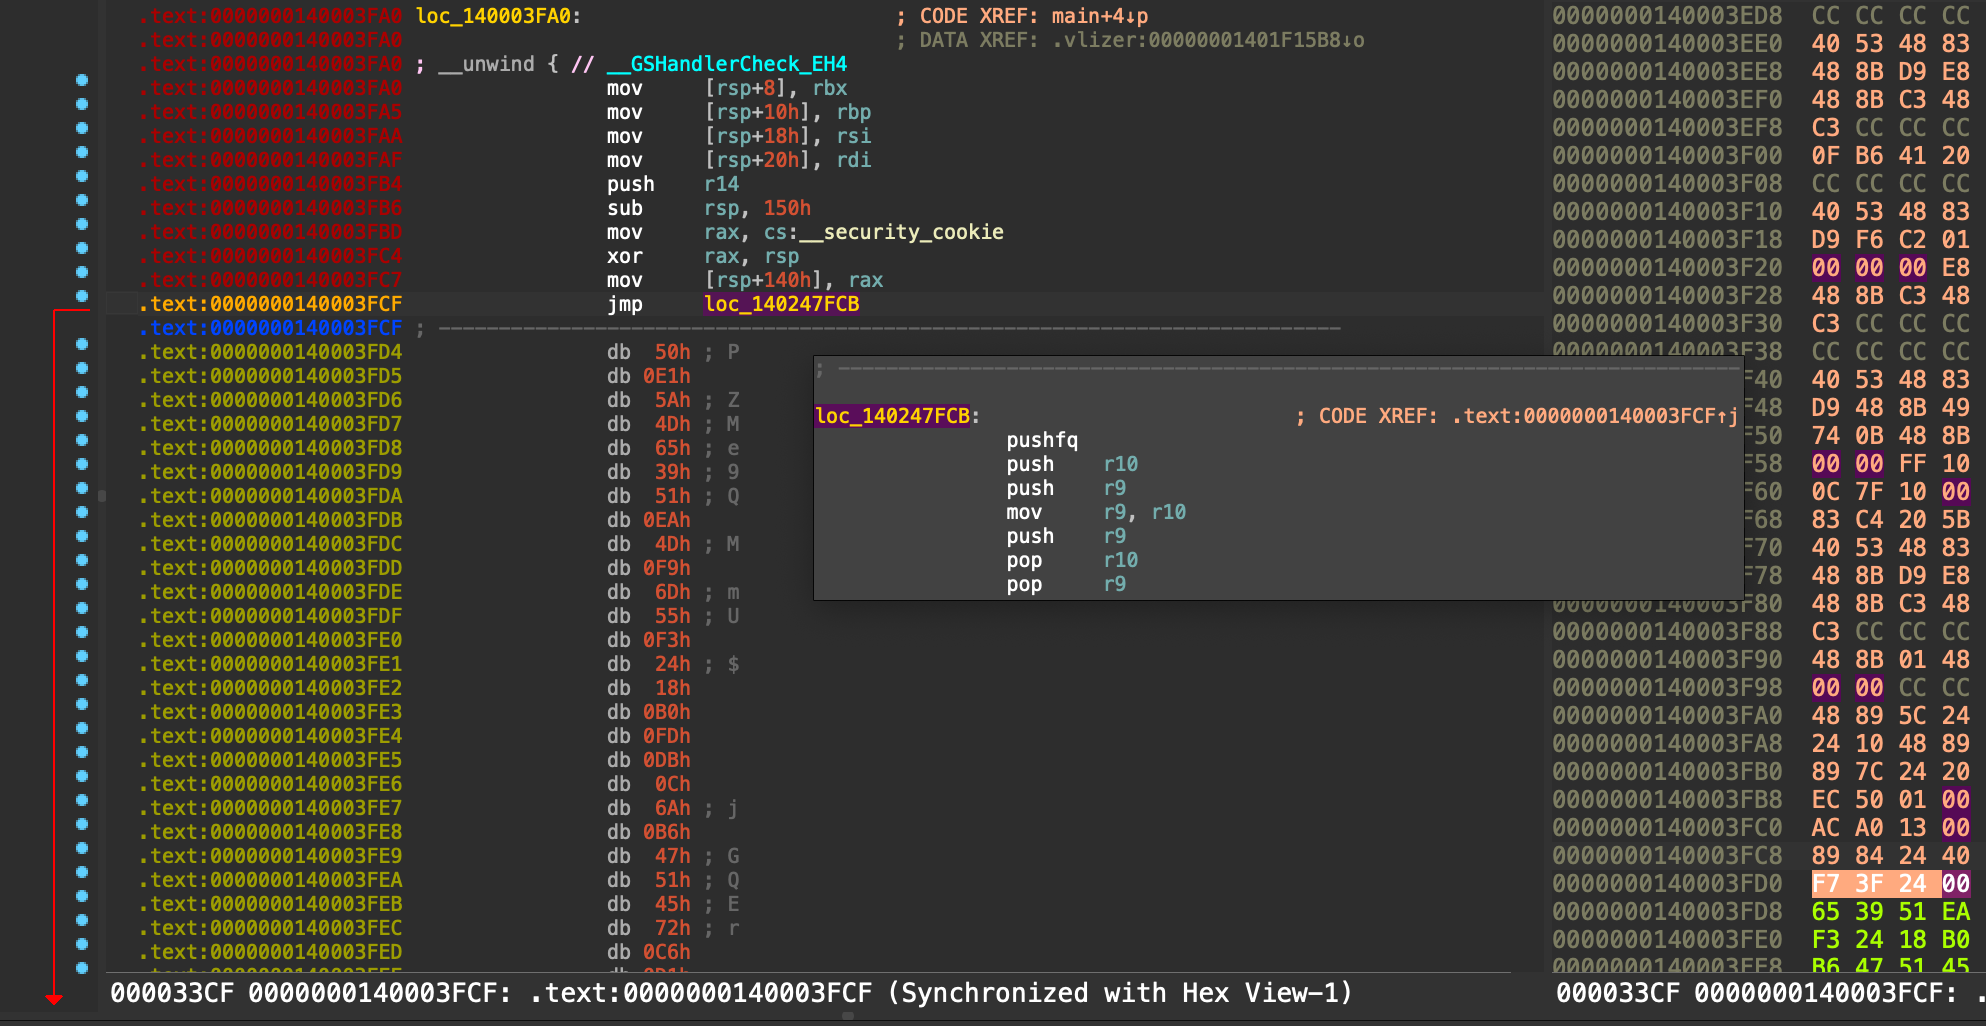
Right after function prologue, there’s a jump to .vlizer section.
pushfq
push r10
push r9
mov r9, r10
push r9
pop r10
pop r9
push 0x6FFF7E12
mov qword ptr ss:[rsp], rsi
mov rsi, 0x10B
mov qword ptr ss:[rsp+0x08], rsi
pop rsi
push 0x6DFB998A
push rcx
pop qword ptr ss:[rsp]
mov rcx, rcx
push r10
push r11
mov r11, 0x2168CB
mov r10, r11
pop r11
mov qword ptr ss:[rsp+0x08], r10
pop r10
push r8
mov r8, rsp
add r8, 0x08
sub r8, 0x08
xchg qword ptr ss:[rsp], r8
mov rsp, qword ptr ss:[rsp]
push rax
pop qword ptr ss:[rsp]
push 0x7EDBB98A
sub rsp, 0x08
push rbx
pop qword ptr ss:[rsp]
pop qword ptr ss:[rsp]
push qword ptr ss:[rsp+0x20]
push qword ptr ss:[rsp]
push qword ptr ss:[rsp]
pop rax
add rsp, 0x08
add rsp, 0x08
push qword ptr ss:[rsp+0x10]
mov rbx, qword ptr ss:[rsp]
push 0x774D91BF
mov qword ptr ss:[rsp], r9
mov r9, rsp
add r9, 0x08
add r9, 0x08
xchg qword ptr ss:[rsp], r9
pop rsp
push 0x7FF9B4F0
push 0x6E3BE496
mov qword ptr ss:[rsp], rax
pop qword ptr ss:[rsp]
pop qword ptr ss:[rsp+0x10]
push 0x76EFDEDA
push r14
mov r14, rsp
add r14, 0x08
sub r14, 0x08
xchg qword ptr ss:[rsp], r14
pop rsp
mov qword ptr ss:[rsp], rbx
pop qword ptr ss:[rsp]
pop qword ptr ss:[rsp+0x20]
push qword ptr ss:[rsp]
push qword ptr ss:[rsp]
pop rbx
push r9
mov r9, rsp
add r9, 0x08
add r9, 0x08
xchg qword ptr ss:[rsp], r9
pop rsp
add rsp, 0x08
push qword ptr ss:[rsp]
push qword ptr ss:[rsp]
pop rax
add rsp, 0x08
add rsp, 0x08
push 0x3F5F103B
mov qword ptr ss:[rsp], r12
push 0x7F7FD870
mov qword ptr ss:[rsp], r12
add qword ptr ss:[rsp], 0x3BFE942D
pop r12
sub r12, 0x3BFE942D
push r13
mov r13, 0x3FD5
mov qword ptr ss:[rsp+0x08], r13
pop r13
jmp 0x00000001401D0319
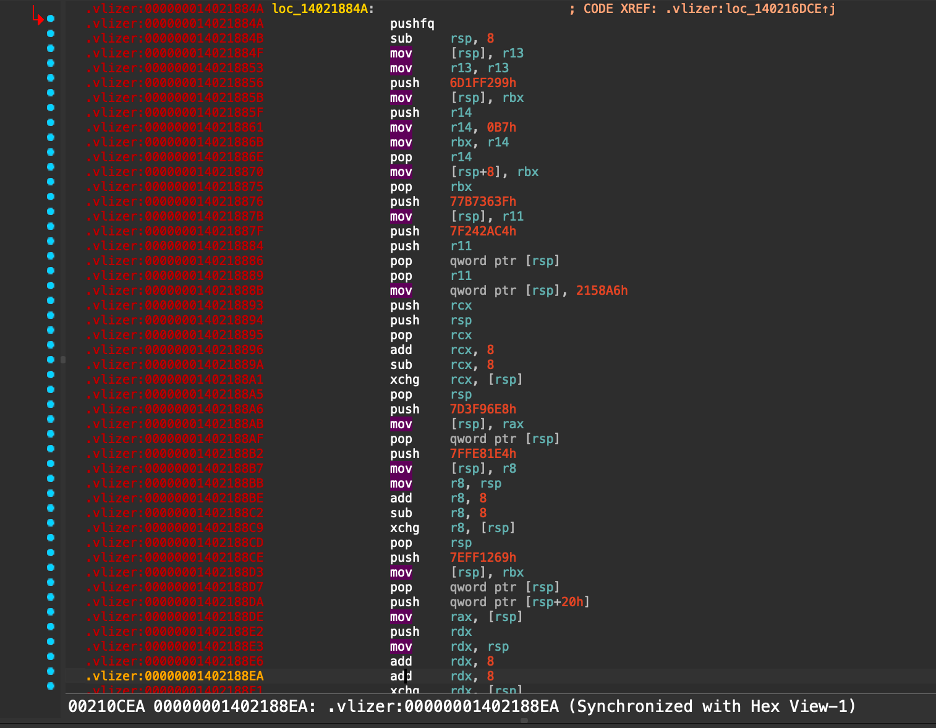
The target stub immediately greets us with the pushfq instruction that saves current Rflags on top of the stack, it then proceeds to do a lot of stack manipulation that mostly looks like a junk code (for example overlapping pops and push->pop sequences with no meaning). Instead of guessing, let’s trace this stub and see what changes in state and the stack in particular. The result is the following: RSP’s value changed by -0x20 (negative 32 bytes) which means that 4 qwords were pushed onto it. Let’s see what they are!
[rsp+00h]– Here lies an offset that we saved right before the jump[rsp+08h]– The Rflags value that was pushed first, after some exchanges it ended up being 3rd instead of 1st in our adjusted stack[rsp+10h]– A static qword (0x10B) that looks like an offset, it was moved to stack directly at0x140247FEC.[rsp+18h]– Another static qword (0x2168CB) that was moved to stack directly at0x140248011.
That was pretty straightforward. In this block we can see that VM initialization has already begun, we saved the flags and 3 constants that look like offsets. Let’s call it vm_setup.
Following the jump, the next chunk starts with a call $+5 instruction, effectively pushing the chunk’s address onto the top of the stack. A large number of obfuscated pushes follow: sometimes registers are pushed directly, and sometimes a random immediate value is pushed first, then the register’s value is written on top of the stack. For now, let’s assume this part saves all host register values and move forward.
Eventually, this comes up.

A spinlock: as long as the mysterious dword at rbx+rbp equals ecx, execution won’t proceed. Looks like our VM is synchronous.
Let’s pause here for a bit. Before making any more assumptions, let’s validate our previous one - the stack saving part. When we dereference rbx+rbp and compare it with ecx, zeroing eax beforehand, we’re definitely not dealing with host registers. There’s no guarantee that before entering the VM, rbx+rbp points to the correct address representing what we need, this must be an internal VM pointer. This reassures us that the above portion of the chunk is responsible for register saving and VM initialization. For good measure, though, let’s trace it from the start all the way down to this spinlock.
Since we’re not allowed to lift this block to LLVM and optimize it to see what’s going on, I decided to fill the registers with unique, identifiable values, such as 0x67, so we can later cross-match them against the stack.
After tracing, let’s dump all qwords in the range from RSP’s value after tracing to RSP’s value before tracing. And voila, we can see all our planted values:
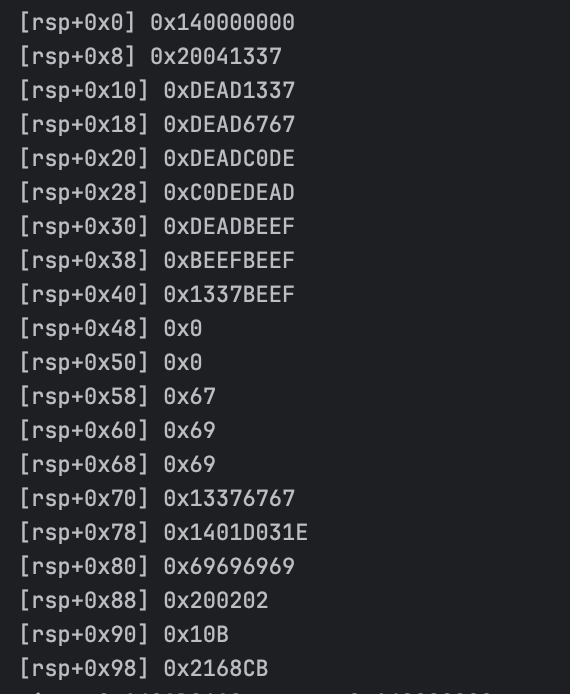
VM Entry
Now, all registers and RFLAGS have been saved on the stack. The VM is almost fully initialized, at least the host’s state is preserved. We can start looking into our spinlock, as it’s the very first part of the actual VM code.
After the previous emulation, let’s examine the register values for clues, particularly those used in spinlock initialization: rbx = 0xD3, rbp = 0x1401B07F8, and rcx = 0x1. Very promising. We essentially have a pointer dereference, offset by a fixed value, compared against 1. It’s a textbook example of struct_pointer->struct_value == TRUE.
For now, let’s assume the pointer stored in RBP is the VM context pointer we’ve been hoping to find. Why? When reverse engineering, you should name as many things as possible, as early as possible, even if some turn out to be incorrect. Doing so helps you understand the bigger picture. Later, once the required context is figured out, any wrongly named or misunderstood items will become clear through the combination of new context and prior understanding.
Here, we lock the entire VM flow based on a value from a structure that lives inside the .vlizer section. Moreover, this address is calculated from VM constants with no input from the host. To me, it screams CONTEXT, so let’s go with that name for now. To find the end of the struct, we can navigate to the address stored in RBP and scroll down until there are no more zeroes. This brings us to 0x1401B0970. Just like that, our assumed VM context struct size is 0x178.
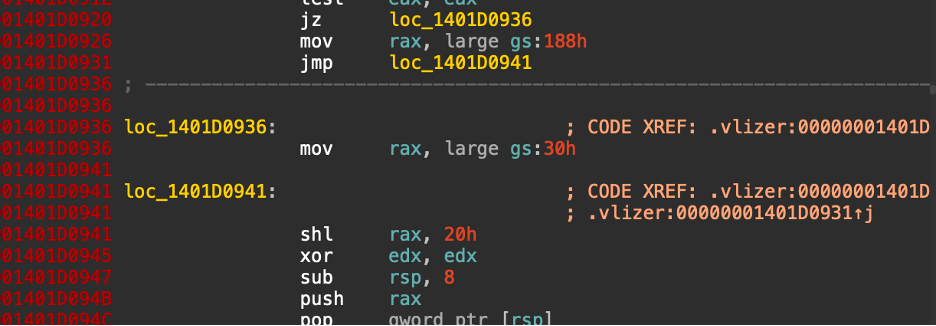
Moving on, the mutex is locked, and we’re now inside the VM. Context reads and writes are synchronous, which is good, as it makes tracking much easier. But we aren’t done with this chunk yet, so let’s continue. The spinlock is followed by a series of stack-related instructions (push, pop, and direct rsp adjustment) alongside cryptographic operations. We then encounter an environment check, whether we’re in r0 or user mode, after which the address of TEB (for user mode) or KiInitialThread (for kernel mode) is saved, pulled from the TIB.
And then all this is followed by the loop, which seemingly does some kind of decrpyption.
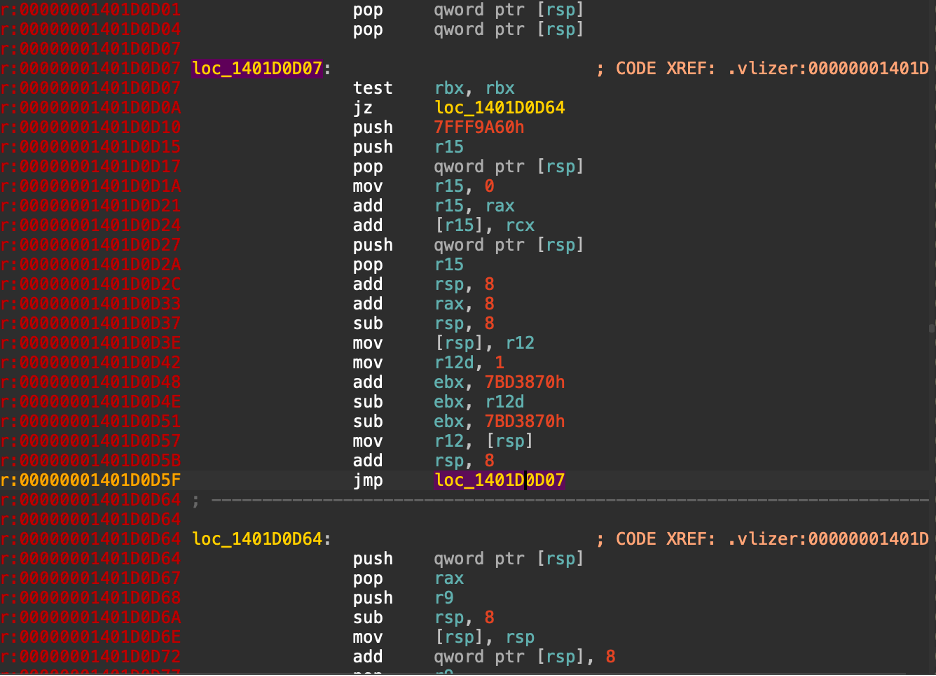
After the loop, a jump is made,which we can assume brings us to our first handler. We now have a high-level overview of what’s happening in this block, and we can confidently name it vm_entry. Here, we save all host registers, lock the mutex to synchronize the VM, retrieve pointers from the TIB, perform some kind of decryption, and then jump further into the unknown.
Okay, but what does it do exactly? Let’s trace it and record all reads and writes to the VM context structure. We can extract a lot of useful information from this, since vm_entry should fully prepare the vm’s context.
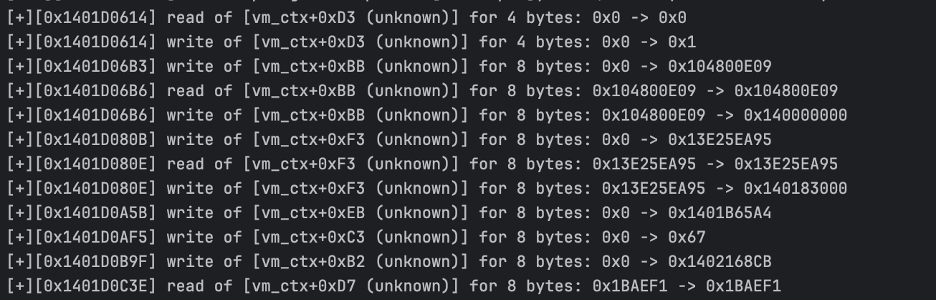
Let’s see what we can understand from here. First, we already know that the 0xD3 field contains an integer (or a BOOL on Windows) responsible for VM synchronization. Then, the 0xBB field is written with the base address of our PE file, so we can assume it’s image_base; 0xF3 receives a value equal to the start of the .vlizer section, so we can assume it’s vm_section_start; 0xC3 is written with 0x67—the exact same value as our RBP—so it’s stack_base_pointer; and 0xEB, 0xB3, and 0xD7 contain some sort of pointers. When we navigate to those addresses in the disassembler, we see random bytes—so let’s ignore these fields for now, as they could be anything from decryption keys to VIP.
Then we have a decryption loop that runs exactly 658 times. It runs until RBX reaches zero, and upon first entry, RBX is 0x292. This value is calculated from immediate constants right before the loop body itself. Looking at what it does, we can immediately see that it’s not a decryption loop at all, but a pointer adjustment loop for some kind of table: 658 qwords are laid out consecutively inside the .vlizer section, and every iteration adds the PE base address to each one of them, turning them into valid pointers. Looking at this table, we can immediately see that each entry points to a VM handler. The start address of this table is calculated by adding the image base to [vm_ctx+0xD7]; so there we go, another VM context field identified: 0xD7 is the VM handler table base.
Below the loop sits a dispatcher, evident from the RAX calculation followed by a `jmp [rax]`` instruction.
Nice.
Looking into a VM handler
A VM handler is a basic block of VM architecture; this can be interpreted as a unique instruction of the architecture. I decided to pick one handler for a short analysis: the one that is being called first. Let’s take a look.
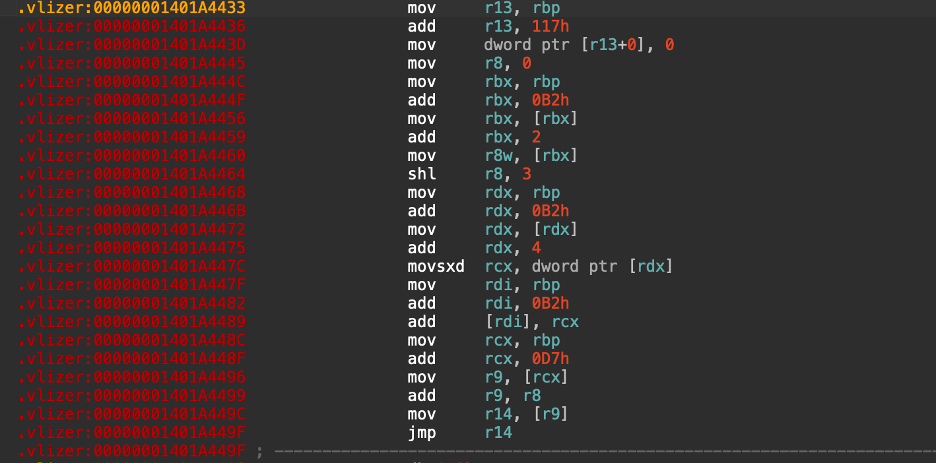
It’s a very simple handler, and we don’t even need to optimize or emulate it to see what’s going on here. First, the dword field [vm_ctx+0x117] is set to 0; then we read a word value from [[vm_ctx+0xB2]+0x2], which is then shifted by 3 (or multiplied by 8, in other words 🙂)—let’s name this variable dword1. Then we read another word, now from [[vm_ctx+0xB2]+0x4], and adjust [vm_ctx+0xB2] by its value. We then get a qword from [vm_ctx+0xD7], add dword1 to it, and then jump to the calculated result.
But as we already know, [vm_ctx+0xD7] contains the base address of the VM handler table. By adding dword1 to it, we specify the exact entry in the table. And our dword1 was multiplied by 8 before, meaning that [[vm_ctx+0xB2]+0x2] contained the next VM handler index! And after retrieving this index, we adjusted [vm_ctx+0xB2] by a word stored 2 bytes lower than the index. Thus, [vm_ctx+0xB2] must be a Virtual Instruction Pointer.
So, to sum this up, we have:
- Found VIP
- Identified that VM handlers are directly chained, and there’s no dispatcher loop
- Next handler indexes are stored as virtual opcodes with no encryption
Cool.
Tracing VM handlers
To understand how the VM works, we should explore and trace VM handlers and monitor state changes. Themida implements a strange architectural decision in its handlers, where every address in the VM handler table points not directly to a handler but to a jmp stub that jumps to the handler, meaning we can intercept handlers easily. Note that this jump stub is not a huge weakness; if it weren’t for that, we could’ve just patched the VM handler table addresses with our own pointers.
After patching, we can run the trace until the VM exits. To get better insight into how the VM works, let’s monitor and record VM handler call sequences. For example, let’s say handler_a calls handler_b, which then calls handler_b again, so the execution chain looks like a -> b -> b. Then, we put handler_a on one level, and both instances of handler_b on the second level as dependents of handler_a; visually, this helps identify subsequent virtual instruction calls.
For emulation, I decided to parse every instruction at RIP inside my on_step hook. If the instruction branches (either jmp, a conditional jump, call, or ret), I calculate the target address. If it falls within the current handler bounds, I do nothing; if it goes outside the VM section entirely, I log a VM exit; if it points to a VM handler, I record the call based on its address. If it’s a self-call (like handler_b calling handler_b), I put it on the same output level; otherwise, I add some whitespace.
Besides that, I made a simple parser for the VM handler table that records all handlers into a map with readable names, making it easier to navigate; later on, I can rename identified handlers.
The result:
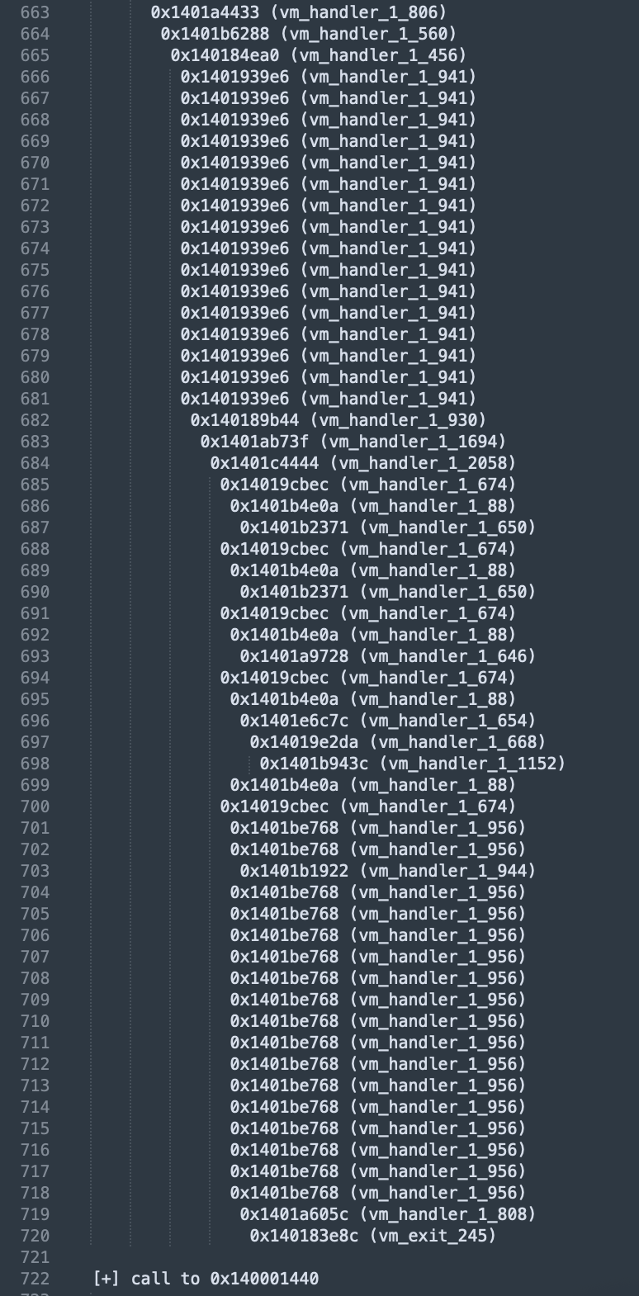
Interestingly, there are two subsequent handler call chains. Right after we enter the VM, we have a bunch of vm_handler_1_941 calls, and then right before exiting, there’s a bunch of vm_handler_1_956 calls. This strongly suggests that these are stack and/or state-related operations. What else do we need to do in a loop when entering and exiting? But let’s see starting with vm_handler_1_956, going backwards.
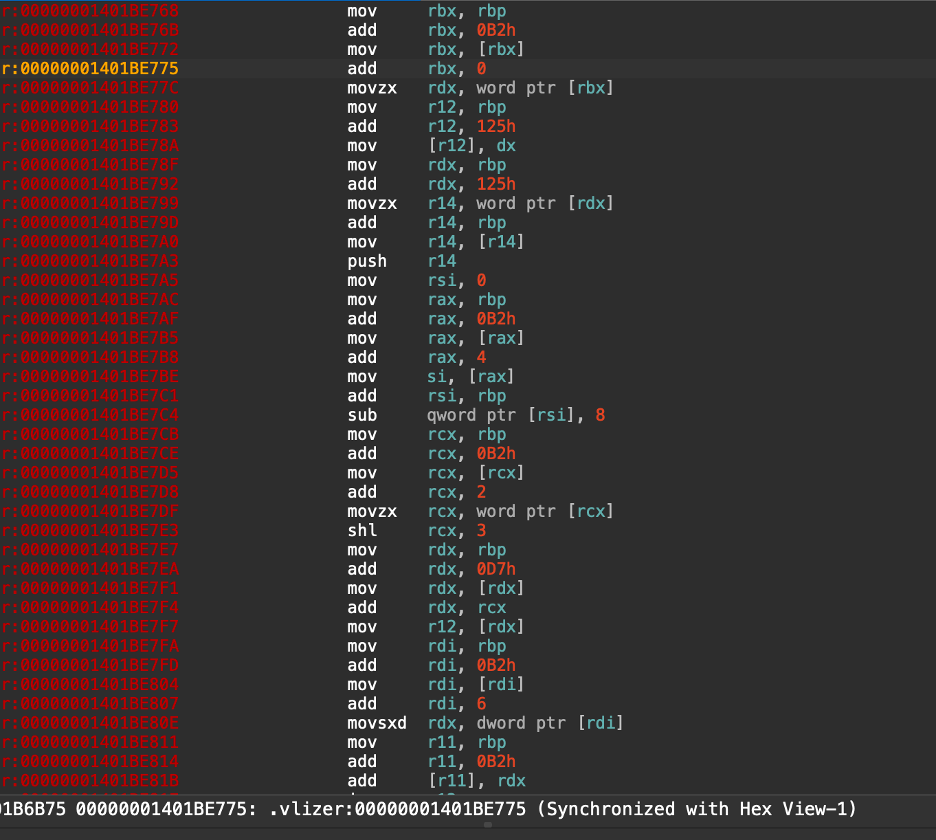
And we can immediately see that this is a VPUSH!
If we look closely enough, there’s only one stack-related operation, and that’s push r14. And what’s going on here is that we take a certain value from our VM context, put it in a register (r14), and then move this value to the host’s stack (regular RSP).
So, let’s analyze it step by step. First, we take a qword from VIP (vm_ctx+0xB2), which is a pointer, we then dereference its value to extract the word that stores an offset to the VM context that we should push the qword from to the stack.
So something like:
const auto qword = *(uint64_t*)(vm_ctx + *(uint16_t*)(*(uint8_t**)vm_ctx->vip));
push qword;
Now the trace looks much better! We have 17 VPUSHes followed by an unknown handler and supposed vm_exit. Let’s look into both, starting with the unknown handler vm_handler_1_808.
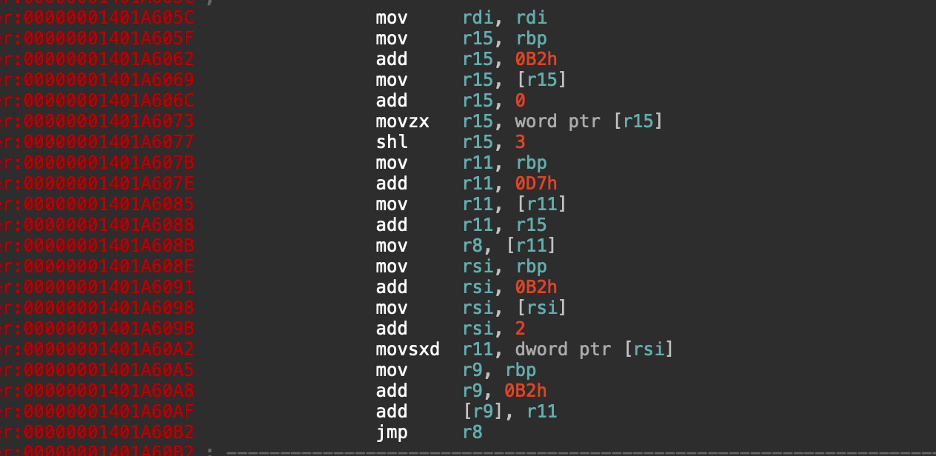
And… It does nothing. It parses an index from current virtual instruction, and then jumps to it unconditionally. Let’s name it vjmp. It’s basically a trampoline between all VPUSH calls and the vm_exit. Now, let’s look into the vm_exit itself.
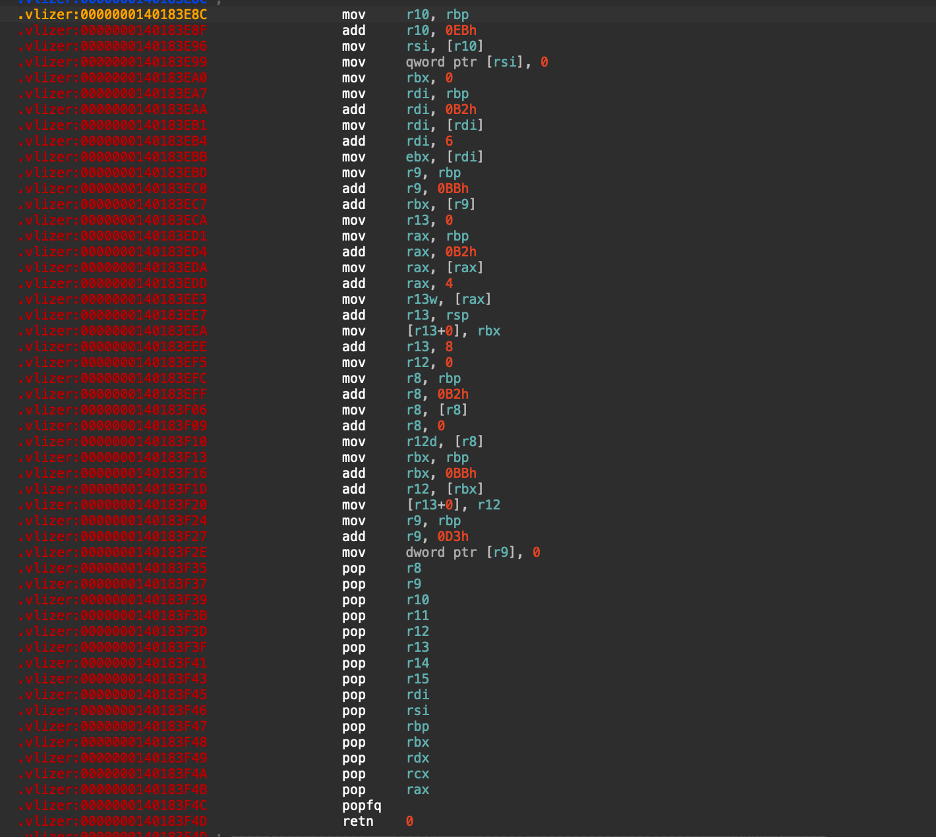
Let’s start from the bottom. We see all host registers being popped from the stack in the following order: r8–r15, rdi, rsi, rbp, rbx, rdx, rcx, rax, RFLAGS, and then it jumps to the value sitting on top of the stack. And now, you guessed it, we have the order of VPUSH calls: first it restores host RFLAGS, then rax, then rcx, and so on. This also gives us a clue that host registers are stored directly in the VM context.
Remember, while analyzing the previous handler, we found that pushes happen directly from VM context qwords dereferenced at offsets read from the virtual instruction. That’s a good guess, but it doesn’t exactly match the number of VPUSH calls made. Obviously, there’s some stack manipulation happening between the lines, but still, what if the assumed order is wrong and there’s a hidden handler, a secret shellcode that somehow reorders, encrypts, and changes everything? We must find out!
To trace it, we can use the good old method of setting registers to magic numbers and then cross-referencing them. Not only can we see what’s being pushed, but we can also verify what’s being saved to those offsets after vm_entry.
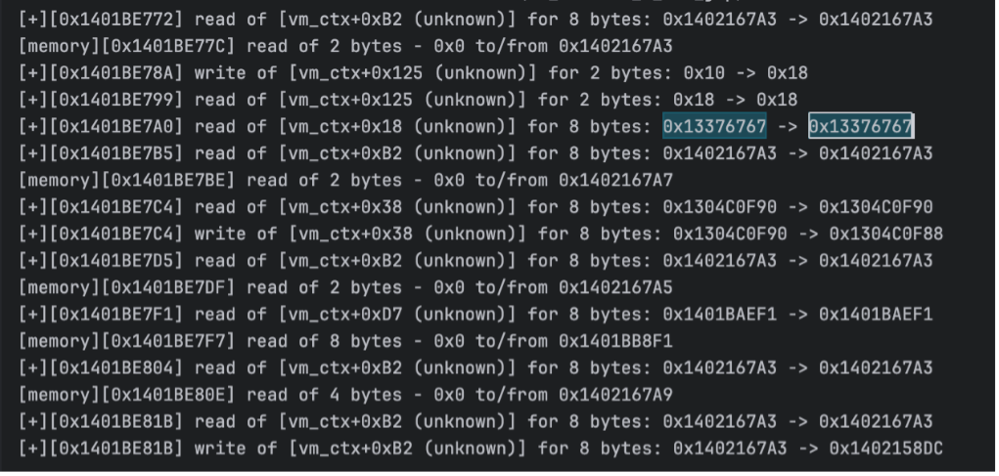
To not waste readers’ time, I’ll just provide the list of registers and their offsets in VM context structure.
struct c_vm_context {
    uint64_t host_rax;      // 0x00
    uint64_t host_rbx;      // 0x08
    uint64_t host_rcx;      // 0x10
    uint64_t host_rdx;      // 0x18
    uint64_t host_rsi;      // 0x20
    uint64_t host_rdi;      // 0x28
    uint64_t host_rbp;      // 0x30
    uint64_t host_rsp;      // 0x38
    uint64_t host_rflags;   // 0x40
    uint64_t host_r8;       // 0x48
    uint64_t host_r9;       // 0x50
    uint64_t host_r10;      // 0x58
    uint64_t host_r11;      // 0x60
    uint64_t host_r12;      // 0x68
    uint64_t host_r13;      // 0x70
    uint64_t host_r14;      // 0x78
    uint64_t host_r15;      // 0x80
}
Looking for where the values are being recorded in the trace, I was pleased to see our vm_handler_1_951 that is also called in sequence, but after vm entry.
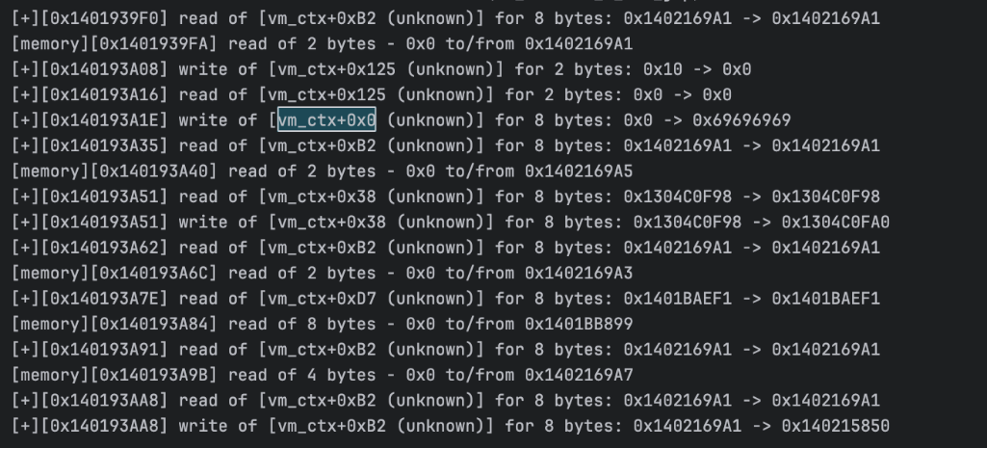
I immediately suspect that this handler is VPOP but let’s see.
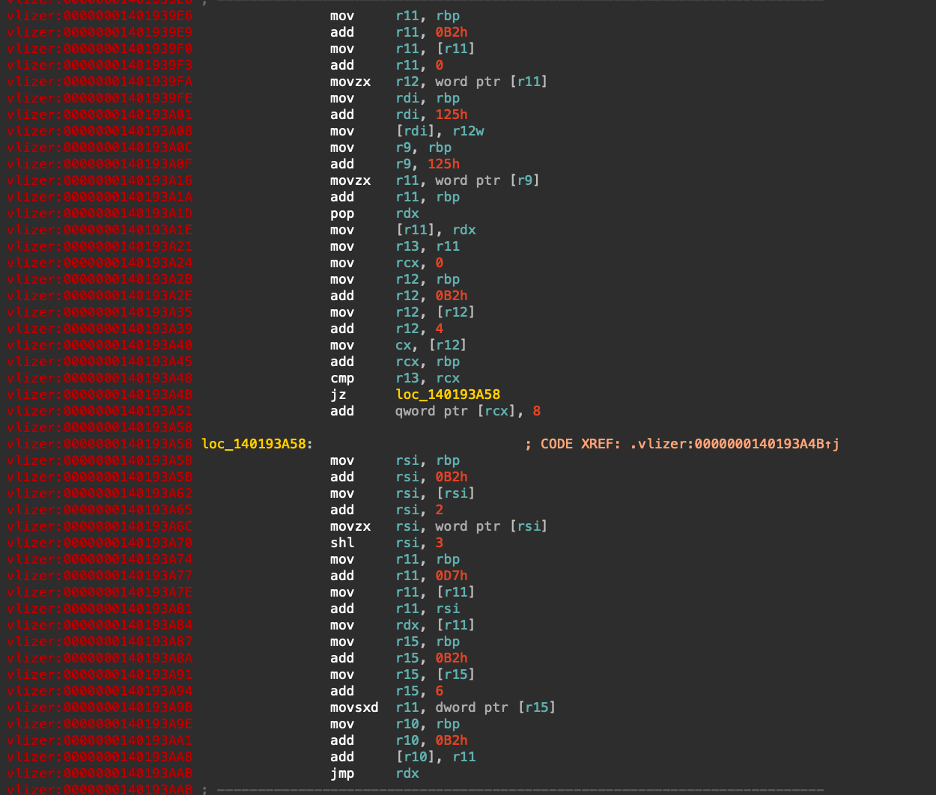
And indeed it is. It retrieves the qword from the top of the stack, pops it into rdx, and then moves the value directly into the VM context. One interesting thing we can observe here, and not just here, but also in the VPUSH handler we analyzed, is that there are two WORD sized VM registers at offsets 0x123 and 0x125 that sometimes hold offsets into vm context fields. Let’s name them vreg_word_0 and vreg_word_1.
Behavior anomalies
By now we have identified vm_entry, vm_exit, vpush and vpop as well as some fields of VM context. Usually, that’s enough for in-depth software analysis in the real world. But we aren’t stopping here. After discovering stack manipulation stuff, I usually go on to analyze anomalies of the VM, so why change what we worship, let’s do it now too. For that, we’ll need to do a full trace of the virtualized code, not just one chunk, meaning that when we exit the vm, we shouldn’t abort the emulation but wait for program completion instead. And we’ll keep the same output formatting approach to have a better view of subsequent calls.
In trace record, I noticed that there were some spots where the vm had exited, then some more calls or jumps were made to unknown regions (by unknown here I mean the ones we haven’t identified as handlers), and then execution came back to vm. For example, below is an example of the regular vm_call view.
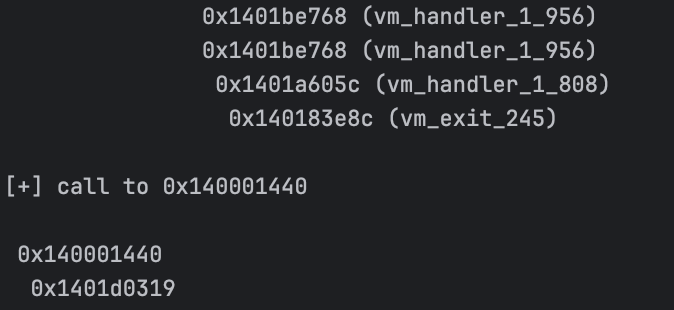
VM Exit here is immediately followed by a function that is being called. However, the exits that lead to unknown are different.
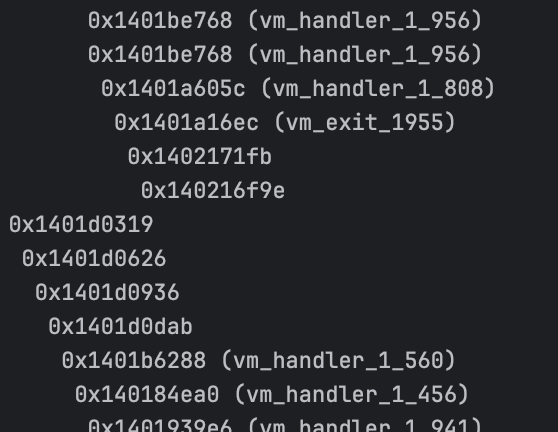
It looks like we exit the vm to execute some kind of shell inside Virtualizer section and then immediately go back. Let’s waste no time and look into what we’re executing.
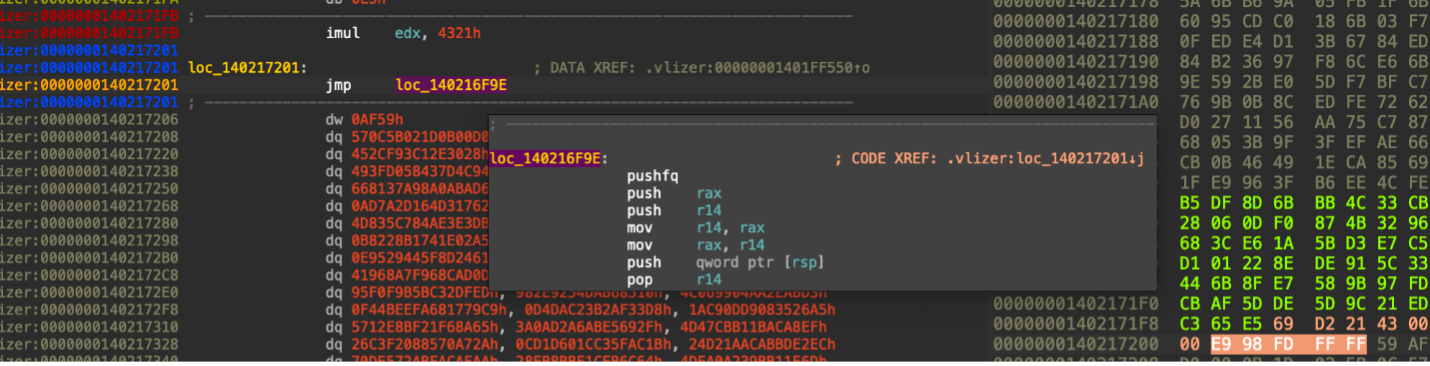
This is a pure instruction! Turns out, when Virtualizer’s VM doesn’t support an instruction, it just records the entirety of it in the .vlizer section and puts a direct jump back to vm_entry. Getting back to the trace I recorded, it looks like vm_exit_1955 (the one that is followed by an unvirtualized instruction) was called 4 times, and every time it exited to an unvirtualized instruction execution. Here’s the list of them:
imul edx, 4321hcmovns ebp, ebxsar eax, 18hsar edx, 8
I think it’s safe to say that this particular vm exit handler is used when the vm is switched back to the host to run an unknown instruction. Moreover, this vm exit looks differently from what we’ve seen before.
VM Exit identification
We have already seen two different VM exits (one serving as part of vmcall implementation and another being a context-switch type of thing), and both follow the same pattern: they restore all host registers using the pop instruction. Then what if we try to identify all VM exits without any tracing? Since we already know the exact location of the VM handler table, we can iterate over all entries and analyze each handler separately by disassembling its contents. We don’t need any emulation for that; we only need to record what was pushed onto the stack, what was retrieved, and what operations canceled out. And if, as a result, we have multiple host registers, as well as most importantly, RFLAGS, being restored from the stack, we can safely assume it’s a VM exit handler.
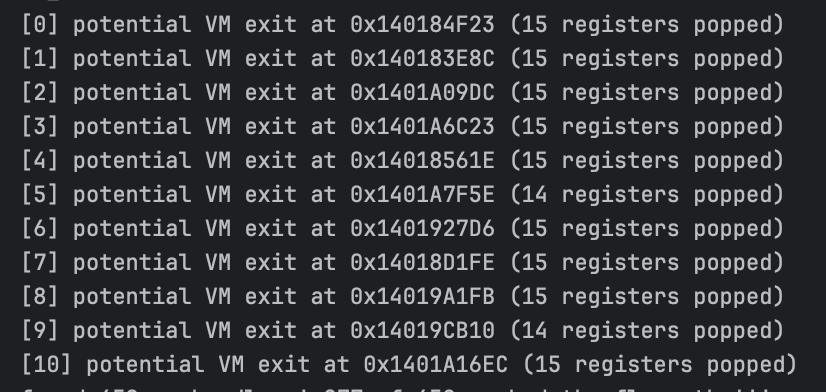
Good! We’ve identified 15 VM handlers (2 variations of VPUSH, 2 variations of VPOP, 1 VJMP and now 10 VMExits), only 643 handlers left!
Virtual Stack Pointer
A VM should have its own stack, and the stack is something that is regularly used. You can’t just manage everything utilizing only registers because their storage is limited; in the stack though, it’s possible to save large amounts of data and keep it for some time. That’s why identifying the VSP (virtual stack pointer), a stack that is used by the VM, is important. Knowing the VSP, we will be able to understand VM behavior even better by analyzing how each handler affects the VSP and its underlying storage.
The operations that always affect the stack are push and pop, so let’s get back to our VPOP (or VPUSH) handler to investigate what’s going on there.
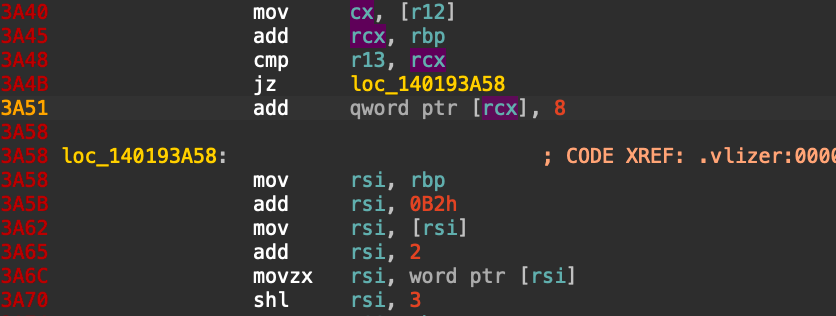
Here we can find a very interesting instruction that adds 8 (the size of a qword, which is the type of data we’re pulling from the stack) to a value stored at the address saved in RCX. When we call the pop instruction, RSP is already increased by 8, so why would we need to have some kind of value decreased by 8 too? The only reasonable explanation is that this is a VSP value sitting there in RCX, let’s validate it.
RCX is calculated based on the virtual instruction, meaning we can’t see the exact value just by looking at the handler (unless we know the VIP value). However, we have a trace record that we can look at to see what is stored in RCX when this instruction is reached. And the value in question is 0x1401B0830, or vm_ctx+0x38.
Okay, so the address stored in vm_ctx->vsp at offset 0x38 points to the virtual stack but where exactly is this stack storage? The first use of vm_ctx->vsp in our trace is a write of a qword to this location, and the qword in question is… RSP!
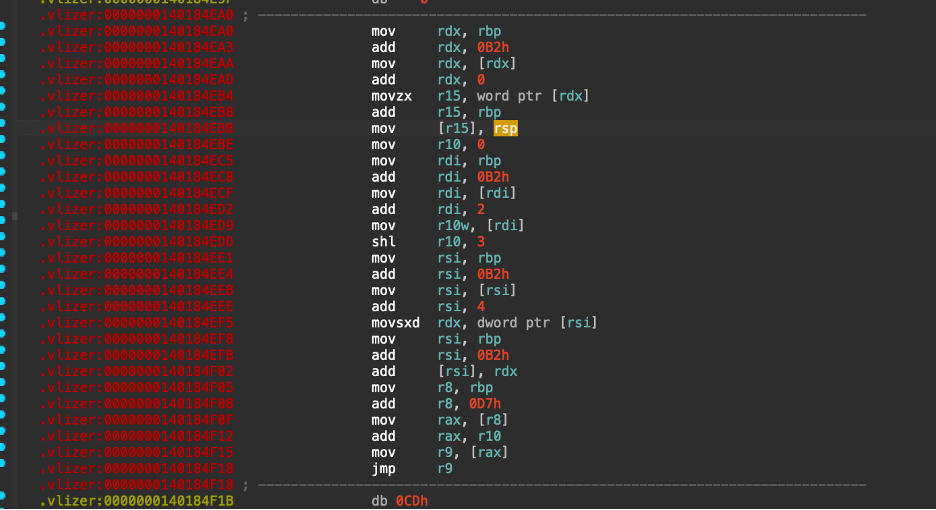
So, it appears that the VM stores all the registers on the stack to preserve the host’s state and then uses the new RSP (which is essentially the host’s RSP decreased by the size of the preserved data) as the VSP. Also, we can now name one more handler: sync_vsp_sp, because we essentially synchronize VSP and RSP values here.
Cool!
Branching
When we’re inside the VM, execution is rarely linear. Most of the time, applications have loops, gotos, conditional branching via if/else statements etc.
To conditionally branch the flow, a sequence of two operations must be performed: a test and a conditional jump. A test can either be a well-known test instruction or an instruction (or a sequence of instructions) affecting the RFlags state in a way that would perfectly replicate test behavior (s/o VMProtect). Regardless of the implementation, one thing is undeniably true – the RFlags state after comparison must be preserved immediately either by pushing the flags onto the stack, or by reading rflags value. Let’s see the approach Themida takes by identifying potential conditional branch in our trace record.
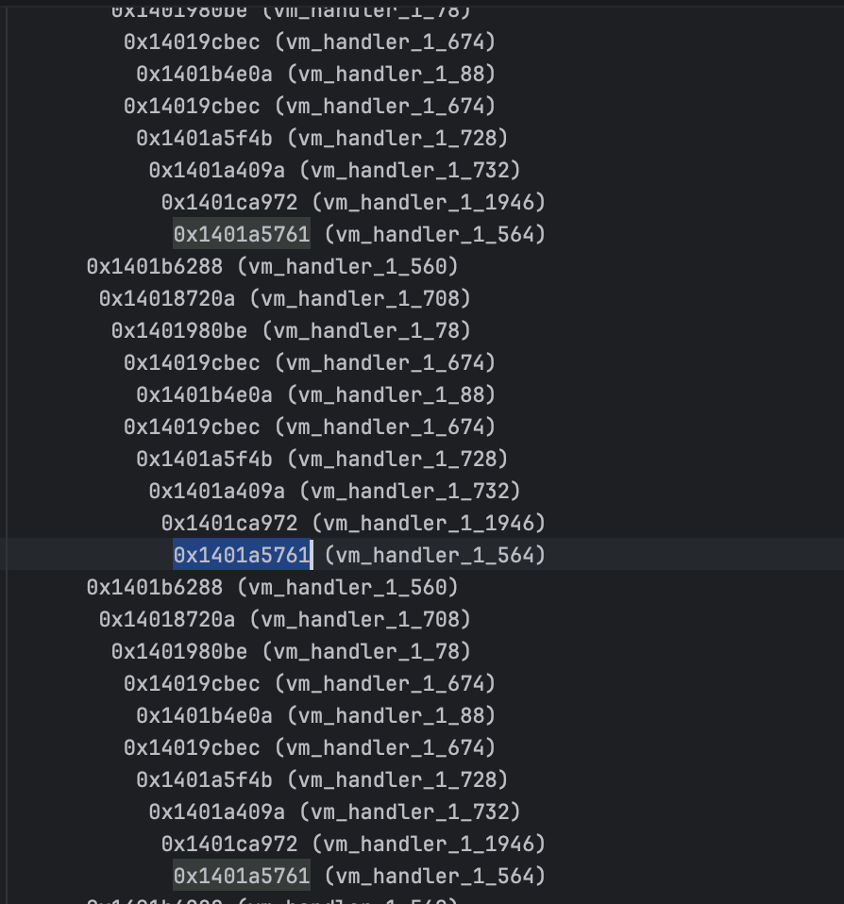
This sequence looks promising. We have a sequence of calls where each handler calls the next one until vm_handler_1_564, instead of going deeper, it returns us back to the starting point of the sequence, which is vm_handler_1_560. This, in fact, looks like a loop: action a -> action -> … -> action n -> check condition -> jump back to the loop start or move forward effectively ending the iteration cycle. So here, I think it makes the most sense to once again go backwards from vm_handler_1_564.
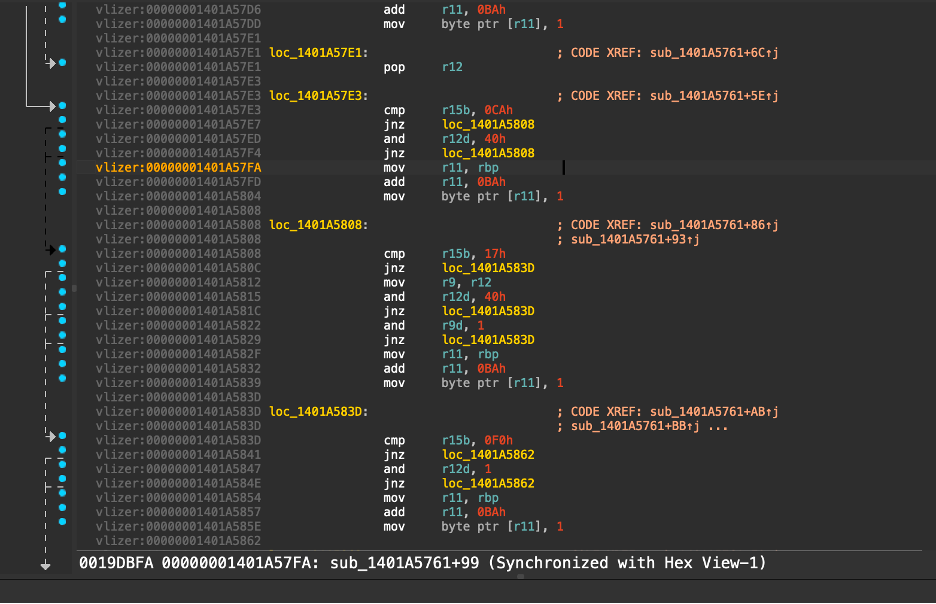
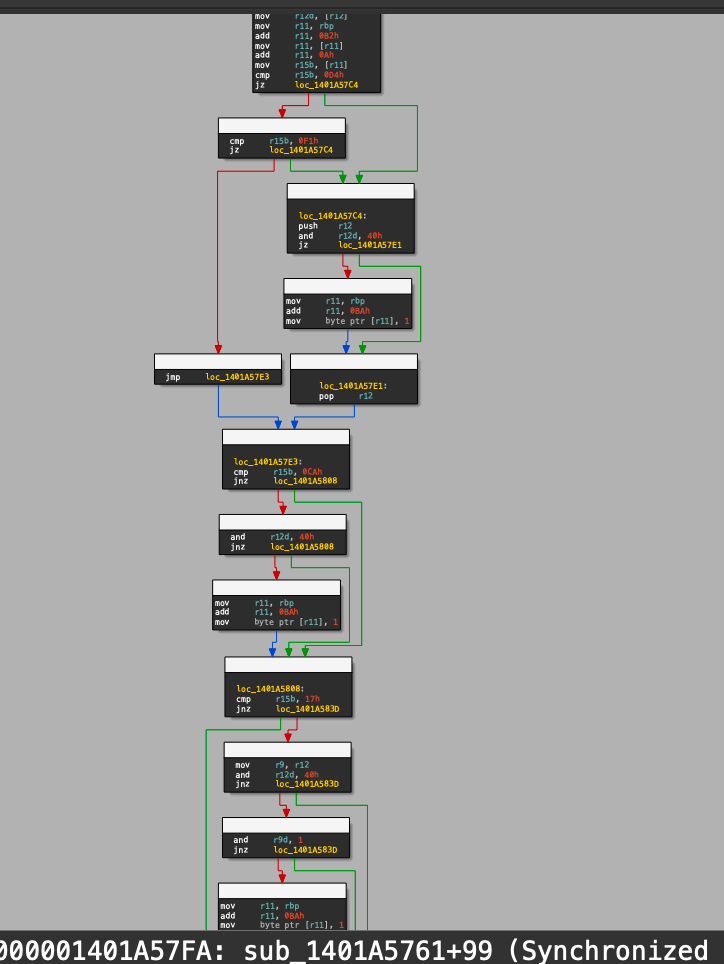
And this handler looks massive. Here we do a lot comparisons against dynamic values from the vm context, and based on that, we calculate the address of the next handler. This looks like a vm_conditional_jump or a vm_branch. Before it, there should be a condition check (a test), so let’s just walk up until we find something!
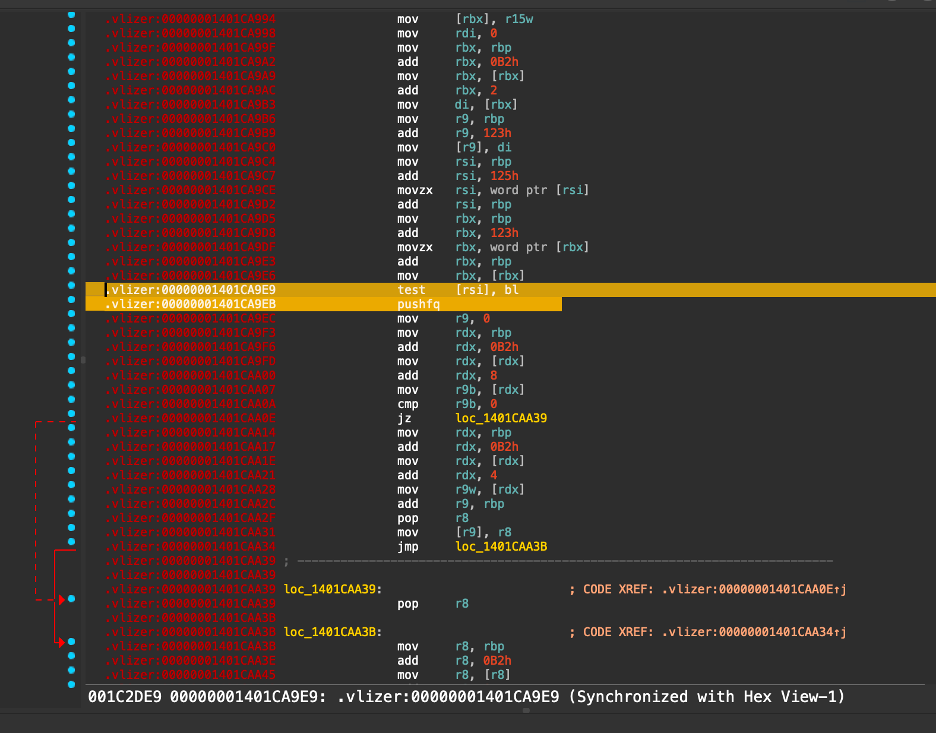
Our vm_handler_1_1946 handler, a VM handler that goes right before vbranch in the execution chain, looks very promising. Here we compare two bytes: one dereferenced from (vm_ctx + vm_ctx->vreg_word_0) and another dereferenced from (vm_ctx + vm_ctx->vreg_word_1), and interestingly, right after the comparison, the handler pushes the flags (the result of the said test) onto the stack. No obfuscation, no flag bit reading—just push everything on top of RSP! Well, that’s a nice gift indeed. What if it’s not the only handler that does this?…
But before trying to find other branch-affecting handlers, let’s quickly unwrap what’s happening in this handler and what values are hidden in vreg_word_0 and vreg_word_1. The comparison is made between the values dereferenced from the VM context address increased by vreg_word_0 and vreg_word_1, meaning these registers store offsets to the VM context. The values of the offsets are read from VIP, so let’s look into our trace to see what those are: 0x48 and 0x48. Both. And we have identified 0x48 earlier—this is the host’s R8 register value! So here we compare the lowest bits of R8 against each other, something like test r8b, r8b.
Very good!
Bitwise handlers identification
Remember, we noticed that after performing the test operation, the resulting flags value gets instantly saved onto the stack, then retrieved and saved in vm context? I do, and there’s one more thing worth mentioning – it’s not only test and cmp instructions that change RFlags, but also any bitwise operation. I’m hopeful we can reuse our approach to VM Exit identification in VM handler enumeration routine for bitwise operation handler identification based on the assumption that every actual bitwise operation is immediately followed by saving RFlags onto the stack. For now, let’s just iterate over VM handlers table, and then analyze each one separately, and when we meet a pushfq instruction, step back one instruction and see what operation’s flags we’re saving.
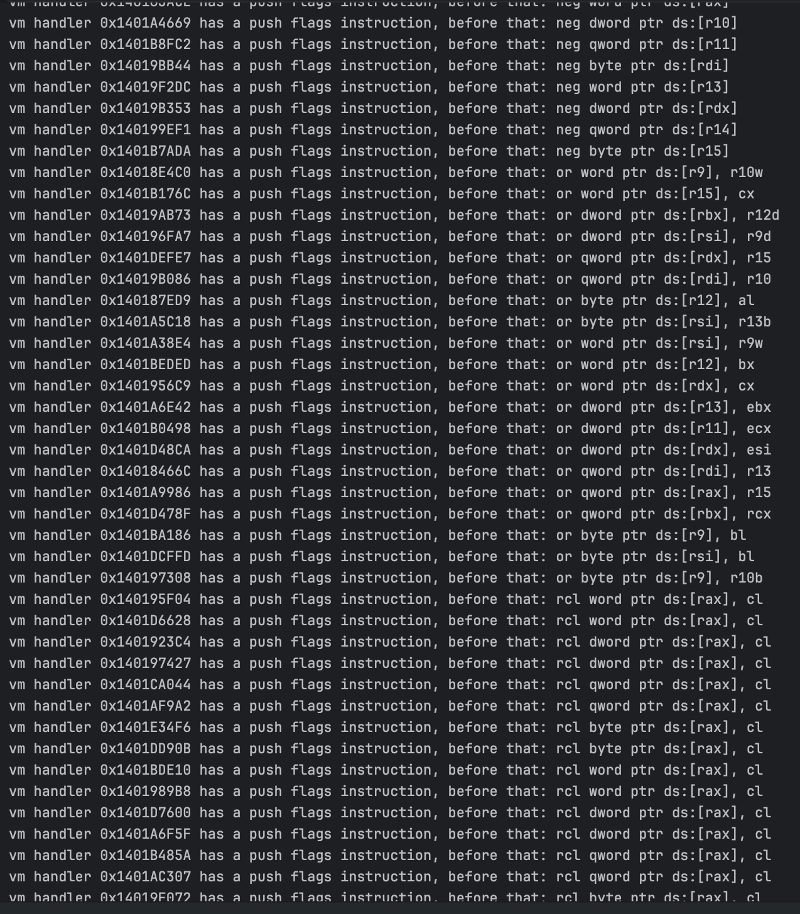
Wow! What can I say, it looks legit! We were able to identify 277 handlers this way, and now we have identified 294 handlers in total, only 364 left to go. We’re picking up the pace!
It’s obvious now that some handlers are implemented more than once and when we compare them, they look similar aside from how (and what) they read from the virtual instruction. Let’s automatically rename them using the following pattern: v{instruction}_{data_type}_{index} so for example test qword ptr ds:[rsi], rdi would become vm_test_qword_1337. And let’s trace everything again for good measure, maybe our output will look even better now.
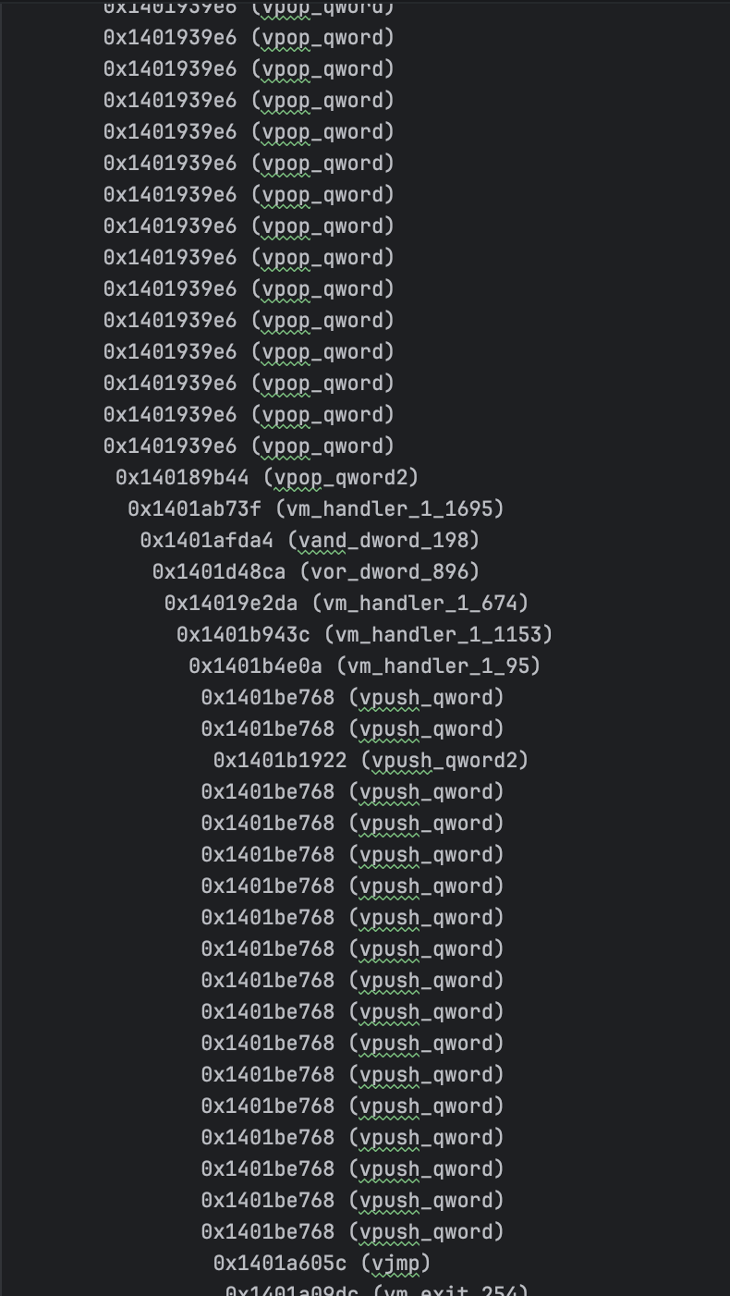
And it somewhat does. Now we have clearer sequences when it comes to bitwise operations. For example, in the screenshot above, it’s evident that the flow is: vm_entry -> save all host registers to vm context -> unknown action -> AND -> OR -> a few unknown actions -> vm_call (vm_exit).
Tearing up handlers
Okay, at this point it’s evident that all handlers follow the exact same flow. To understand our program’s behavior better, we need to simplify the handlers somehow. Remember, no LLVM, no optimizations! So how do we approach this fun task?
Walking through all handlers so far, I’ve noticed a clear pattern for absolutely all handlers: at first, they read a virtual instruction using VIP address, then sometimes they write VM registers with values from virtual opcodes, then they do their task, and then they get back to working with VIP by moving the pointer itself and calculating the next handler address.
And virtual instruction opcode reading at the start of each handler is implemented using the same general-purpose register exactly 5 times!
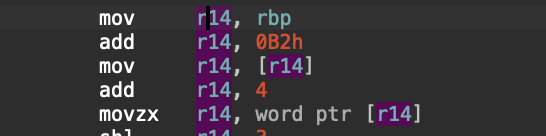
And there are no exceptions to this rule, at all! Sometimes, a register is cleared before that, but the virtual opcode reading flow itself remains the same.
The dispatcher of the following instruction inside each handler looks similar in all handlers: first, the next handler address is calculated based on the current virtual instruction, and then the VIP itself is adjusted.
So basically, virtual instruction semantics are a bunch of data points: first goes the data needed for current handler (or no data at all), followed by next handler index and then goes an offset to next VIP. Virtual instructions don’t follow each other but are spread across the section instead. Not a big issue.
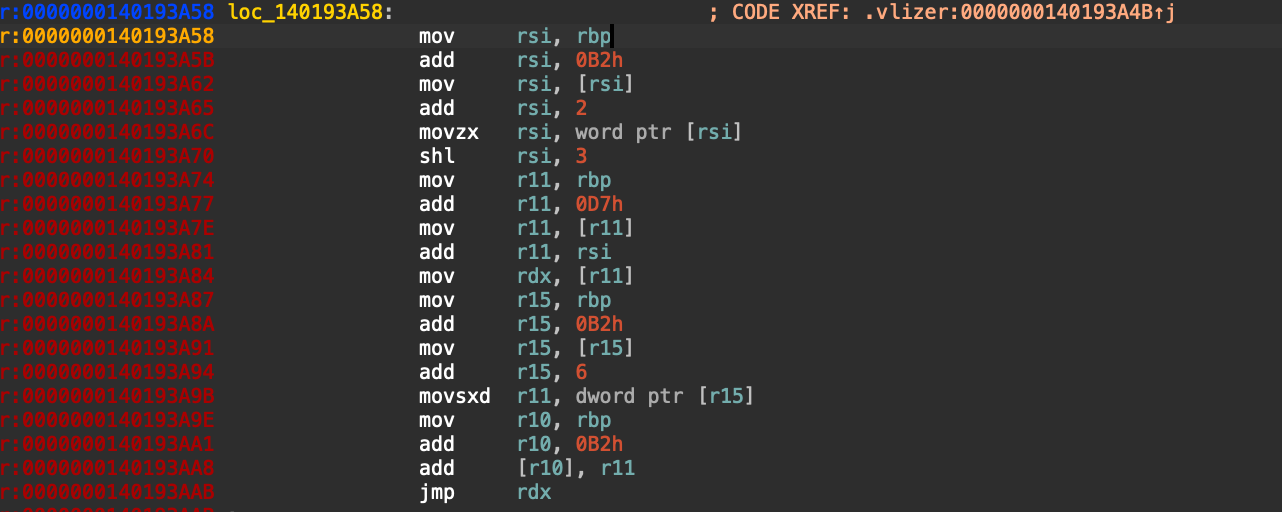
Now, we’ll try to actually decrypt and understand our virtual instruction set by matching virtual instructions against handlers. The idea is simple, but the execution may not turn out to be so.
Let’s start from the dispatcher to understand how virtual instructions are chained. The dispatcher chunk of handlers is very telling because there we have two operations: VIP adjustment to the next virtual instruction and calculation of the next VM handler’s address. The pseudocode of the dispatcher part would look something like this:
const auto next_handler = *(uint8_t**)(vm_ctx->vm_handler_table + (vm_ctx->vip->next_handler_idx * 8));
*(uint8_t**)vm_ctx->vip +=  vm_ctx->vip->next_vip_offset;
jmp next_handler;
So, for every independent handler, we can pretty much identify offsets to the next_vip_offset and next_handler_idx fields of its respective virtual instruction. For now, we’ll skip the data offset(s) identification entirely because our current task is to chain independent VM handlers into a complete flow.
Upon disassembling the handlers, it turned out that the dispatcher only has 2 ways of branching: via a direct jump by a register’s value or by returning to the address that is pushed onto the stack. I’ll be tackling direct jump dispatchers first because the overwhelming majority of handlers have this kind of dispatcher. Overall, we’re looking for 3 subsequent (from the end) references to VIP, or vm_ctx + 0xB2: the first dereference pulls the next VM handler index from the virtual instruction, the second dereference pulls the instruction length (or an offset to the next virtual instruction), and the third dereference should be a write of the new VIP value.
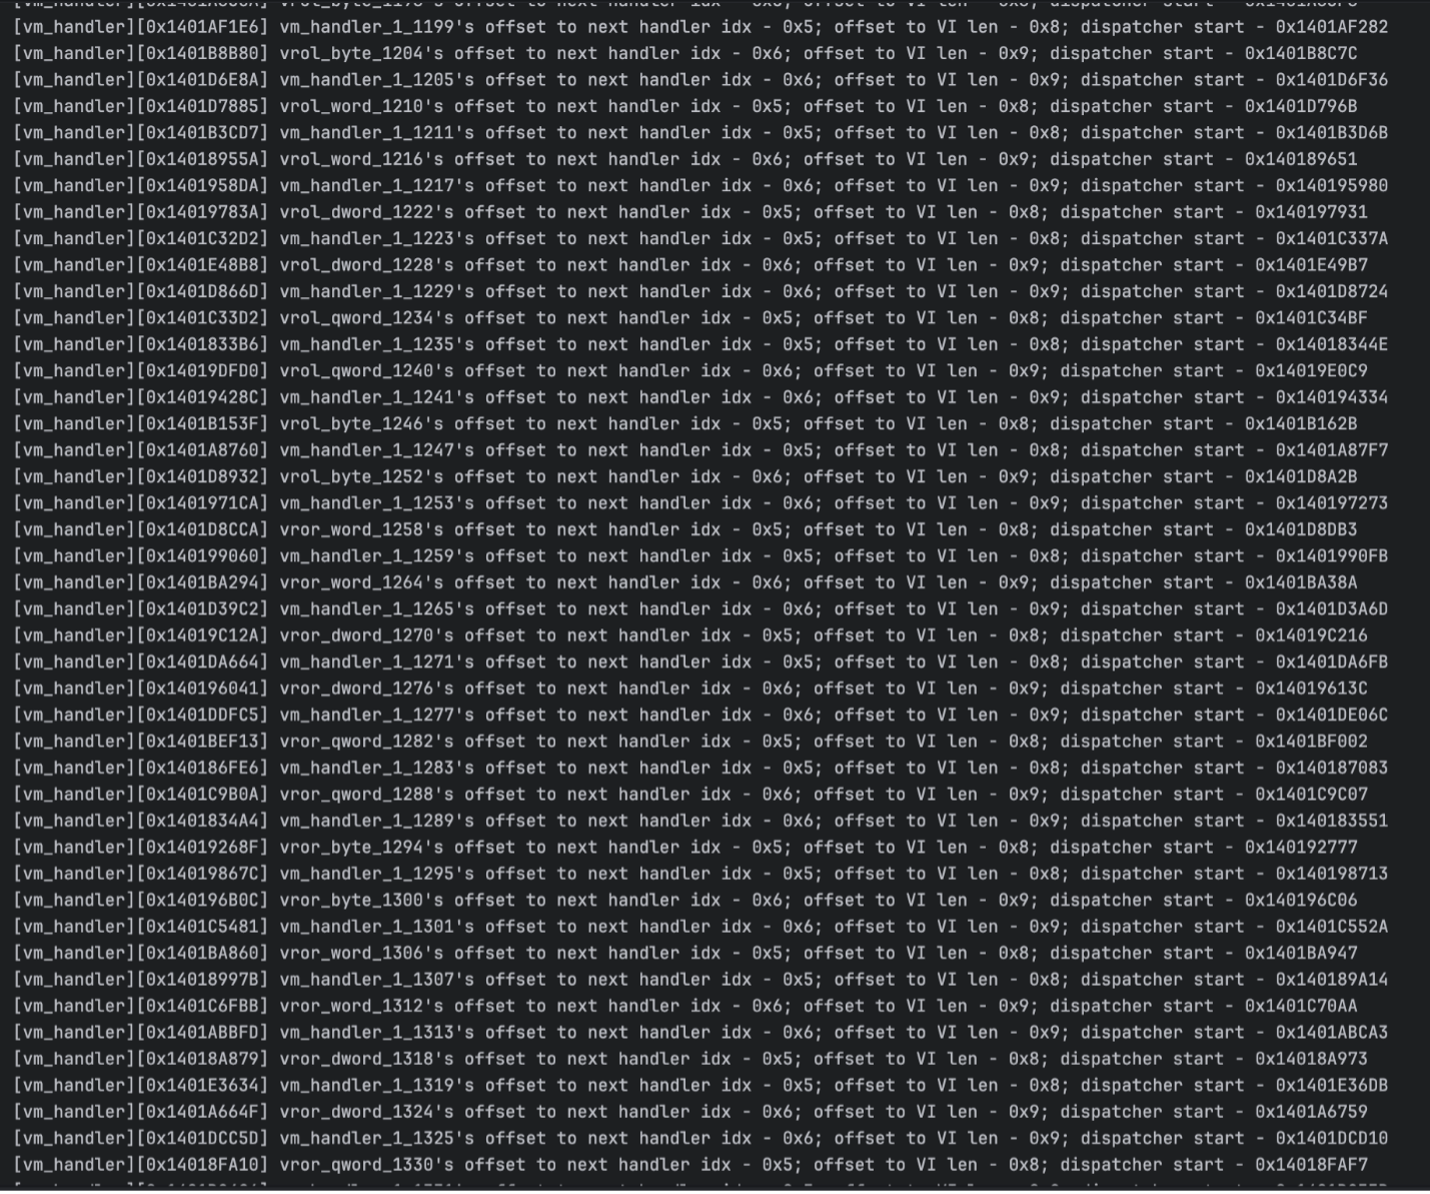
Looks good! I decided to identify 3 key points simultaneously to reduce the risk of calculating wrong values. Those data points are: an offset to the next handler index from the instruction start, an offset to the virtual instruction length (or an offset to the next virtual instruction), and a dispatcher block start address, a point where we start calculating everything, adjusting the VIP and jumping to the next handler. Out of all 658 handlers, 597 were identified as having a clear dispatcher block and readable offsets within their respective virtual instructions. The dispatcher analyzer algorithm wasn’t able to identify 25 more VM handlers. On top of that, we have already identified 11 VM Exit handlers. So our goals right now are:
- Investigate what went wrong with the 25 handlers that had
jmp regdispatcher type but failed to be disassembled - Adjust dispatcher analyzer code so it can identify the handlers that dispatch via
retinstead ofjmp reg.
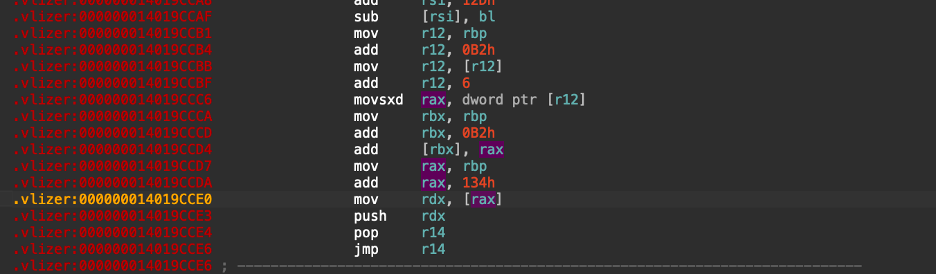
Looking at any of those 25 handlers, it appears that the next handler address is not static and is not read directly from VIP as it usually is, but rather a dynamic address stored in vm_context. Sad to see, but at least we get to add a new variable to our vm context structure – a pointer at the 0x134 offset, we can call it something like vptr_stub because it stores an address that we jump to from some handlers. Not good, not terrible! Moving on.
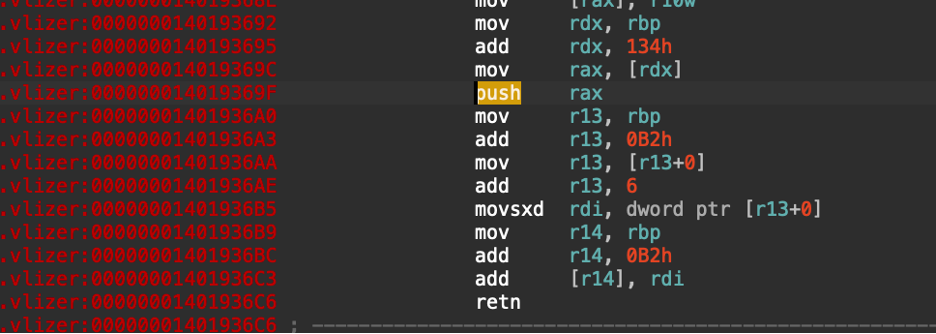
Okay, so the handlers with a ret type of dispatcher also retrieve their next handler address from VM context’s vptr_stub field. Let’s look above to see if we ever override this pointer inside the handler.
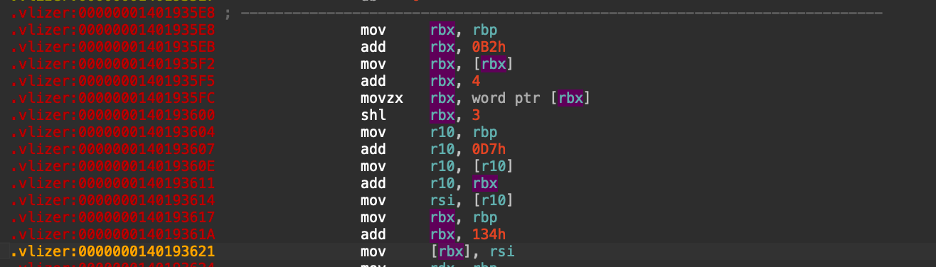
And we actually do! In fact, if we look closely enough, we can notice that the address of the next handler is parsed exactly like it is in handlers with a direct jump: we pull the index from VIP+{offset}, then we multiply it by 8 to get the offset to vm handlers table start and then we add it to vm handlers table base address, effectively getting the address of the necessary table entry.
Let’s try to make a simple script that would work as follows: find writes to vm context + 0x134 (vptr_stub), check if virtual opcode based querying is used to calculate the value that is being written to this vm context field. If there are no overrides or reuses of the said 0x134 (vptr_stub) field besides direct writing and then reading before pushing its value onto the stack, we can assume this is just an obfuscation around a direct jump once again.
And…
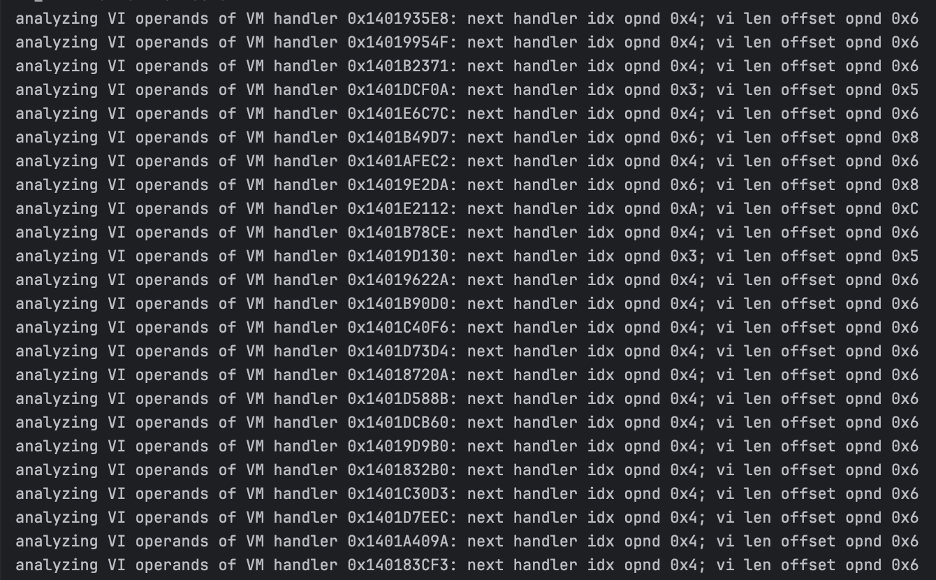
Looks like the use of the vm context’s 0x134 (vptr_stub) qword is just an obfuscation technique where a pointer is put to this field and then is immediately followed, every single handler ending with retinstruction had exactly two vptr_stub pointer usages, one writing a value based on the index of the next vm handler pulled from the respective virtual instruction, and another reading a value into a register that is then pushed onto the stack to be returned to.
Now that we know how vptr_stub field can be used to store the next handler address, let’s get back to 25 handlers that exit with jmp register instruction but the register’s value is calculated via vptr_stub, effectively adding intermediary step. We can try to understand how vptr_stub value is calculated (if at all), and if it matches our current pattern of extracting word offset from virtual instruction, we can parse it too.
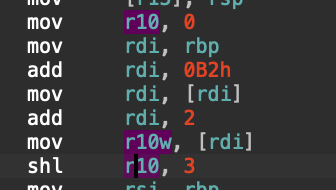
Looking into those handlers, I noticed one more type of next handler address calculation that couldn’t be identified earlier. The pattern is pretty simple: first, a register is nulled; then an actual pointer to the next handler offset within current virtual instruction is calculated, but when it comes to dereferencing this address, instead of using movzx to write the lower 16 bits of the register with a value from the pointer and override the upper 48 bits with zeros, it moves directly to the lowest 16 bits of the register, effectively replicating movzx instruction because the register’s value is all zeros by now.
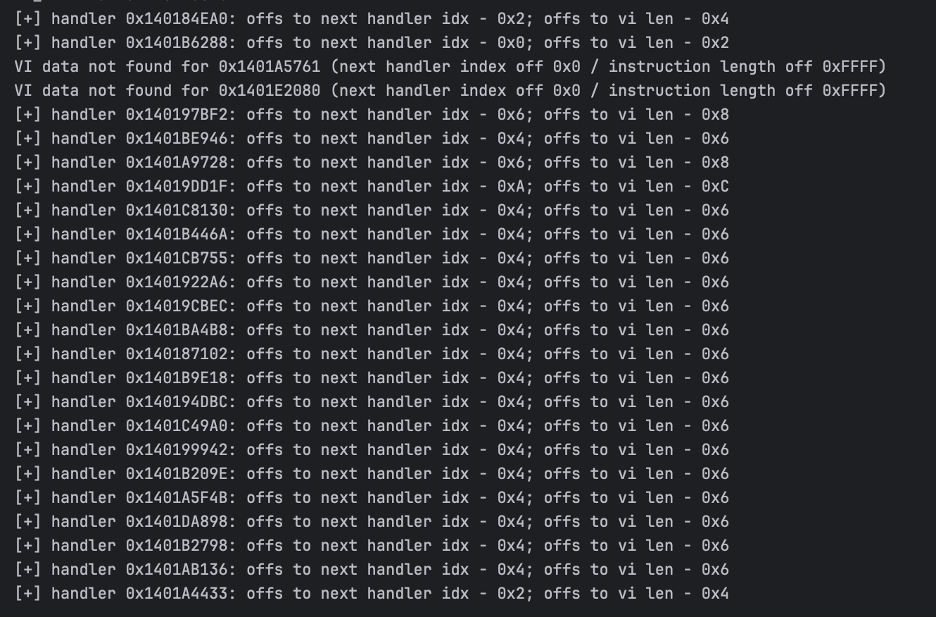
Let’s take a look at the handlers that we couldn’t find virtual instruction lengths for. First one is vbranch that we identified earlier, it has a complex logic of conditonal branching and next handler calculation. Second one is also some kind of branching, but way more simple.
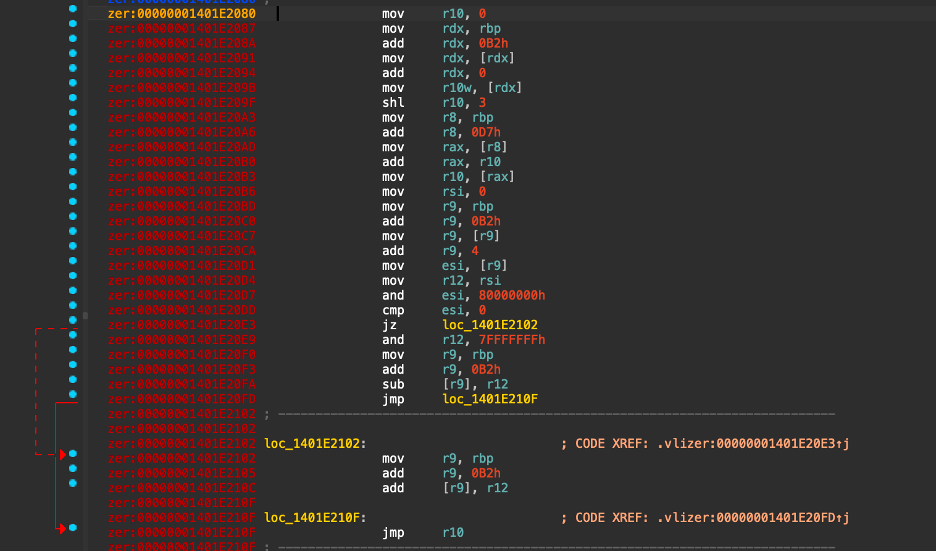
Interestingly, this handler conditionally moves VIP back or forward. For now, let’s let these two handlers be, and we’ll come back to them very soon.
Restoring the flow
We have two key identifiers of EVERY virtual instruction of the VM, and we can try to reconstruct the flow entirely based on that, so let’s give it a shot.
First, let’s get back to our very first vm entry for a moment to try to find some clues on how the very first handler is dispatched. For that, let’s get back to the dispatcher chunk’s trace record.
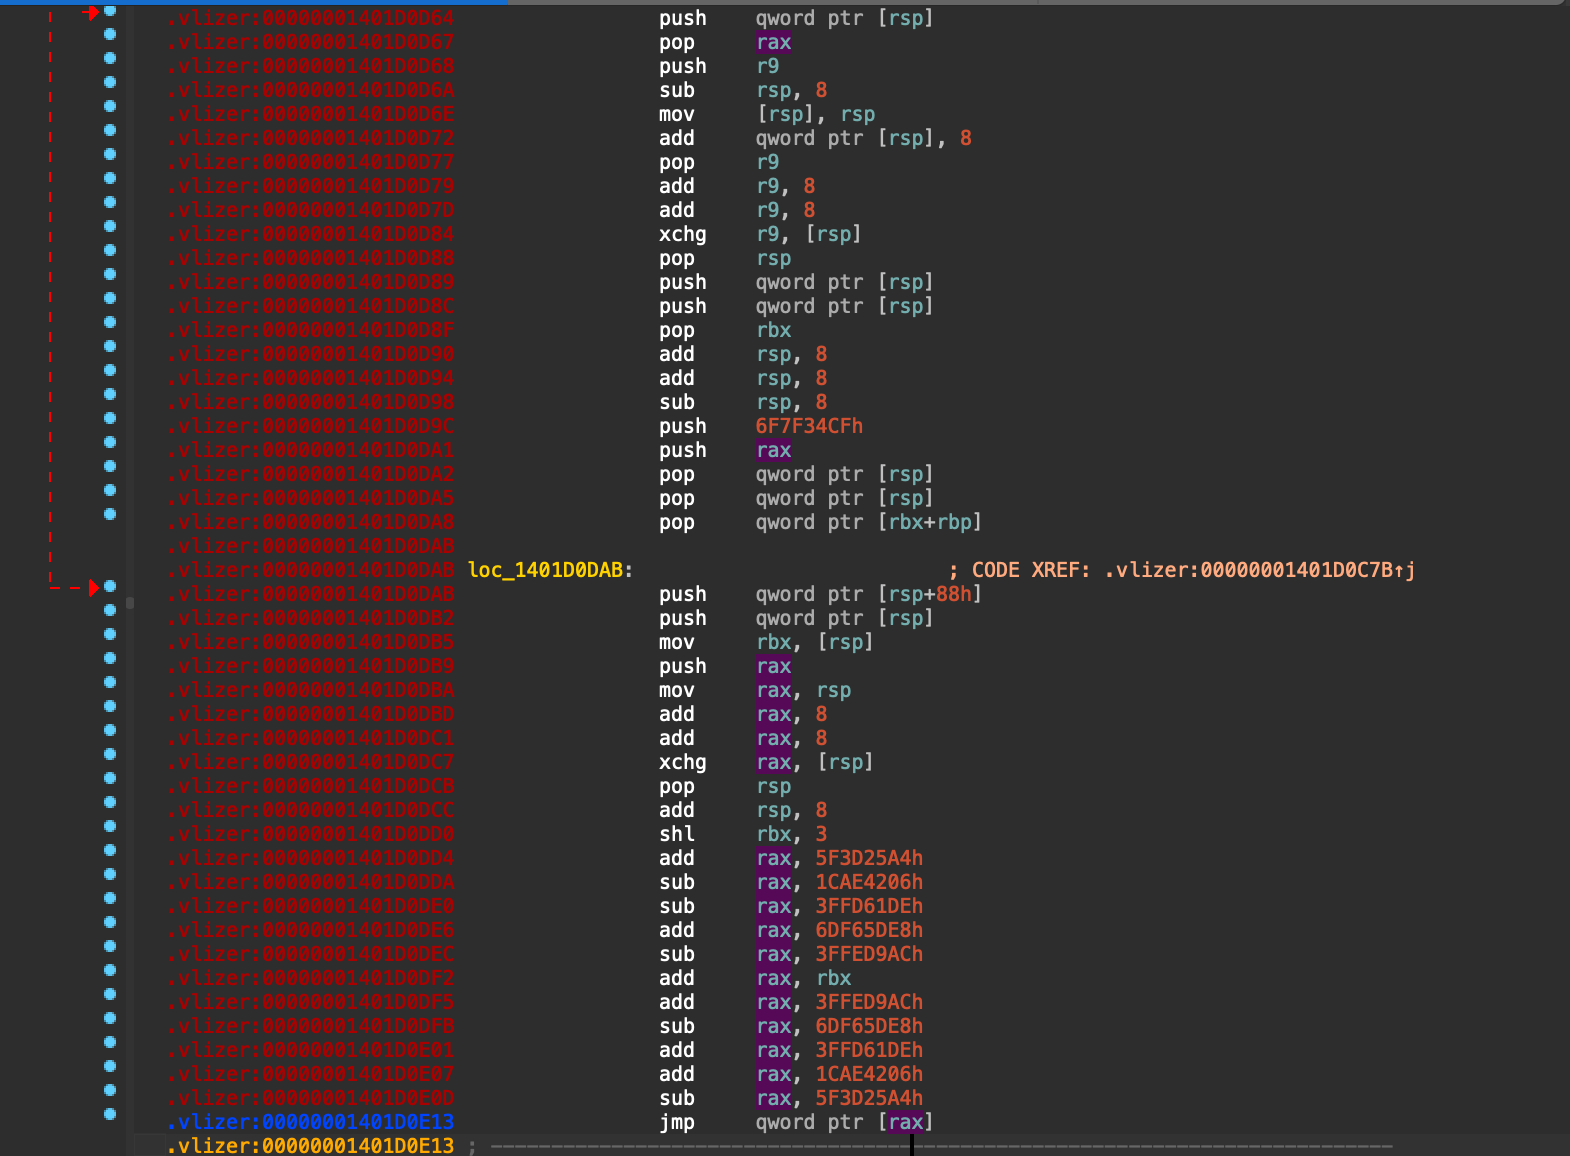
Particularly, we’re interested in how rax is calculated and what value VIP holds when jmp [rax] is reached.
When the jump is reached, rax contains a pointer to the VM table that contains necessary entry. The value of this pointer is calculated by adding the index of the VM handler multiplied by 8 to the base address of the table. The index is stored in RBX and equals to 0x10B.
The VIP value is calculated above by adding 0x2168CB to the image base.
Both of those values were seen in the very first stub of the vm entry procedure.
Let’s proceed to building an execution flow based on the virtual instructions available to us.
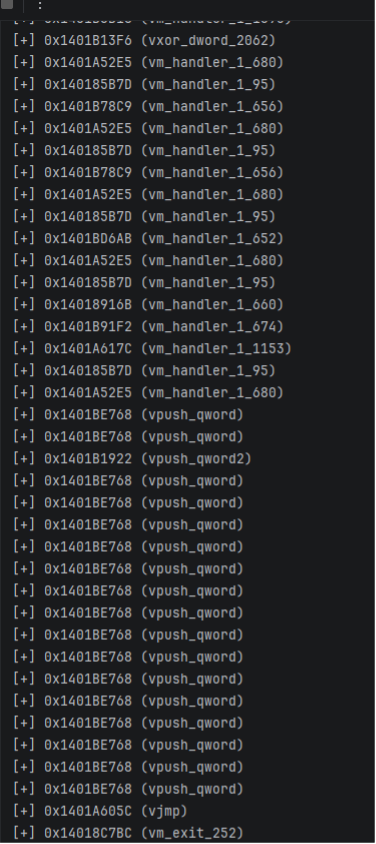
Looks about right! The only thing is, we crashed after the vm exit because we never addressed the context switches. Especially in this case, this is not just vm exit but rather a part of vmcall, and we somehow need to find out how the target address is calculated and put onto the stack so we can check if vm exit expects us to return back to VM, and if it does, where it would return to.
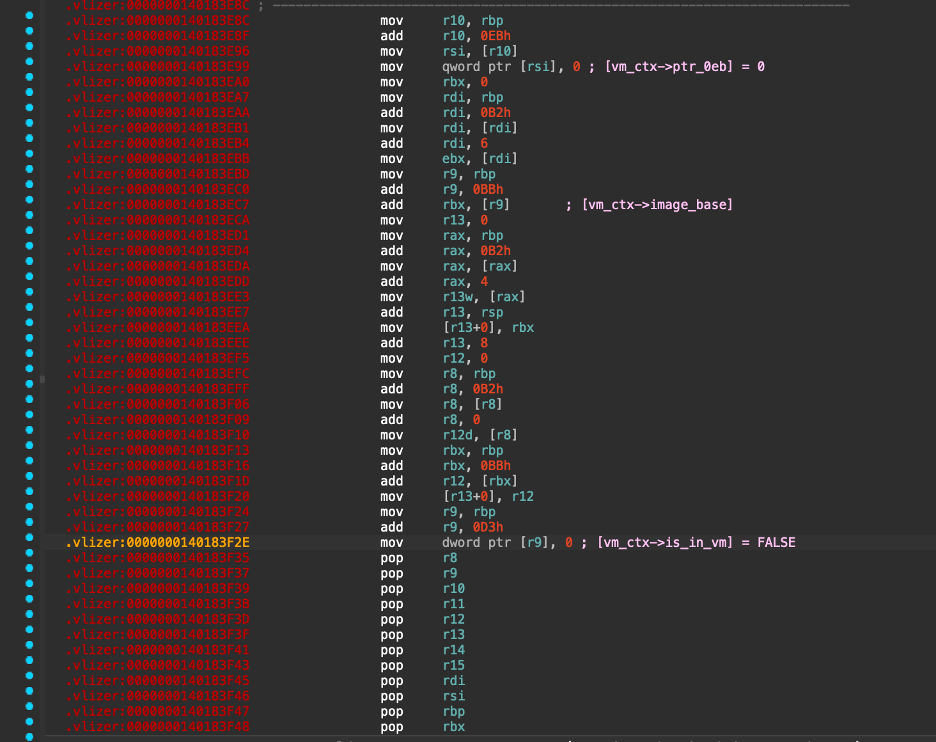
The common thing among VM exit handlers is that before restoring the registers, they reset the is_in_vm variable of vm context (the one responsible for spinlock), and before that they move the return address directly onto the stack. The offset to the return address is stored within the virtual instruction opcodes; it’s parsed as a dword (in the handler above, see mov ebx, [rdi]), and then increased by the image base, effectively making it a valid address. No obfuscation here. Let’s try to parse all VM exits to find an offset to the location of the return address offset within the virtual instruction the same way we found offsets to the next handler index and instruction length.
Now a precaution: here, the return address is a data entry of a virtual instruction, meaning it should make more sense to start analyzing data points of all virtual instructions regardless of their meaning, not just vm exits. However, at this point, I’m focused on rebuilding the flow and all data points and types identification of all instructions sounds like an overwhelming work (for now), so I’ll focus on VM exits only.
There are several types of VM exits serving different purposes, for example, if Themida couldn’t virtualize an instruction during compilation, the stub of this exact instruction is created and stored inside the VM section, this stub is followed by a direct jump back to the vm entry. However, before jumping to the VM entry and saving the thread state, we land in a chunk that, as we figured out before, provides an offset to the VIP and the index of the handler to call first.
Let’s automatically identify where each of those stubs leads, and run our interpreter.
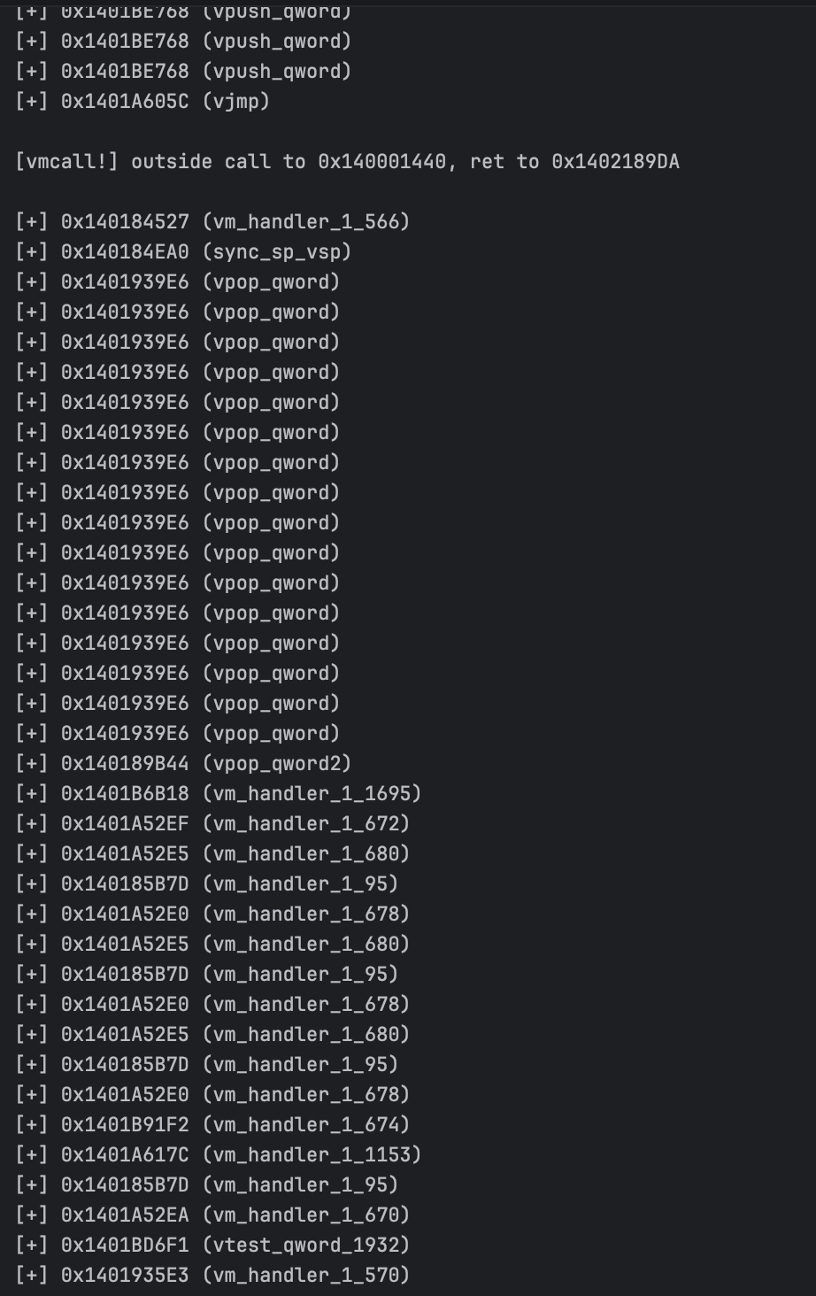
Now we got much deeper, and all calls match the original trace, which is indeed a good sign. However, we now crashed at vbranch (vm_handler_1_570) virtual instruction that we never addressed (remember the 2 branching instructions that can move the VIP forwards and backwards).
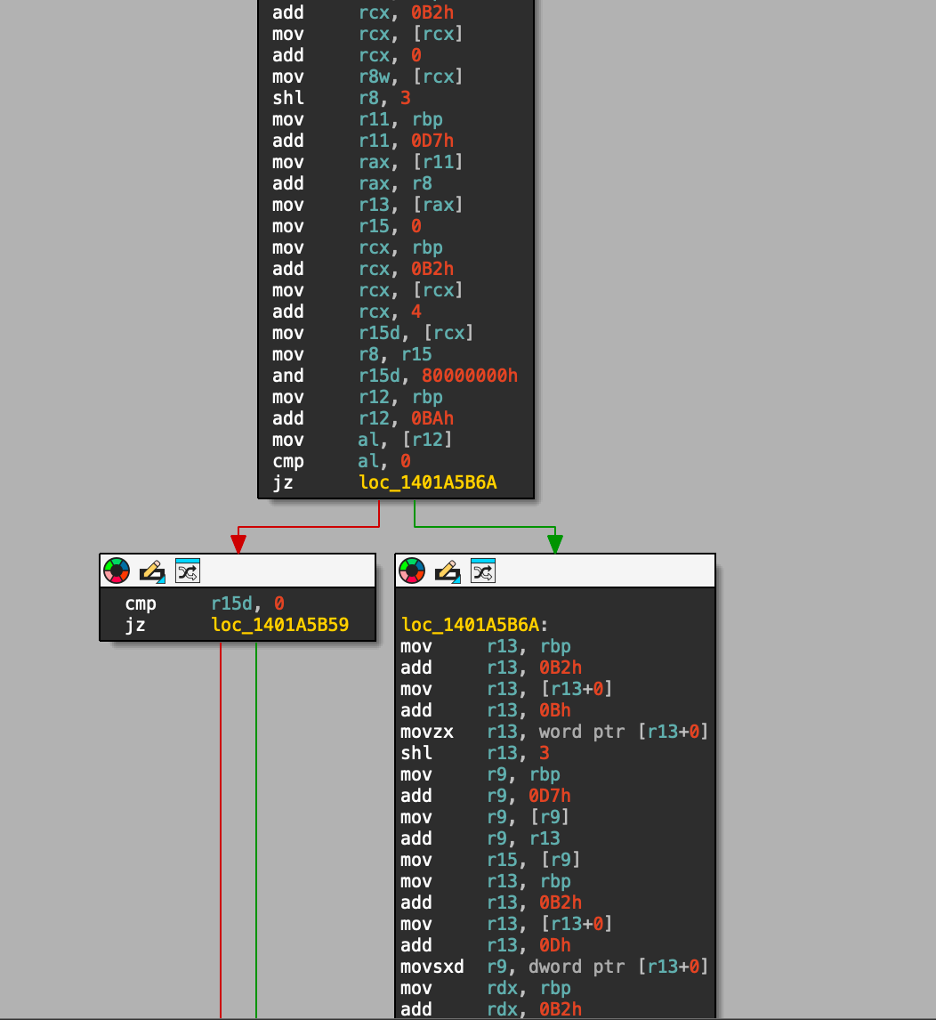
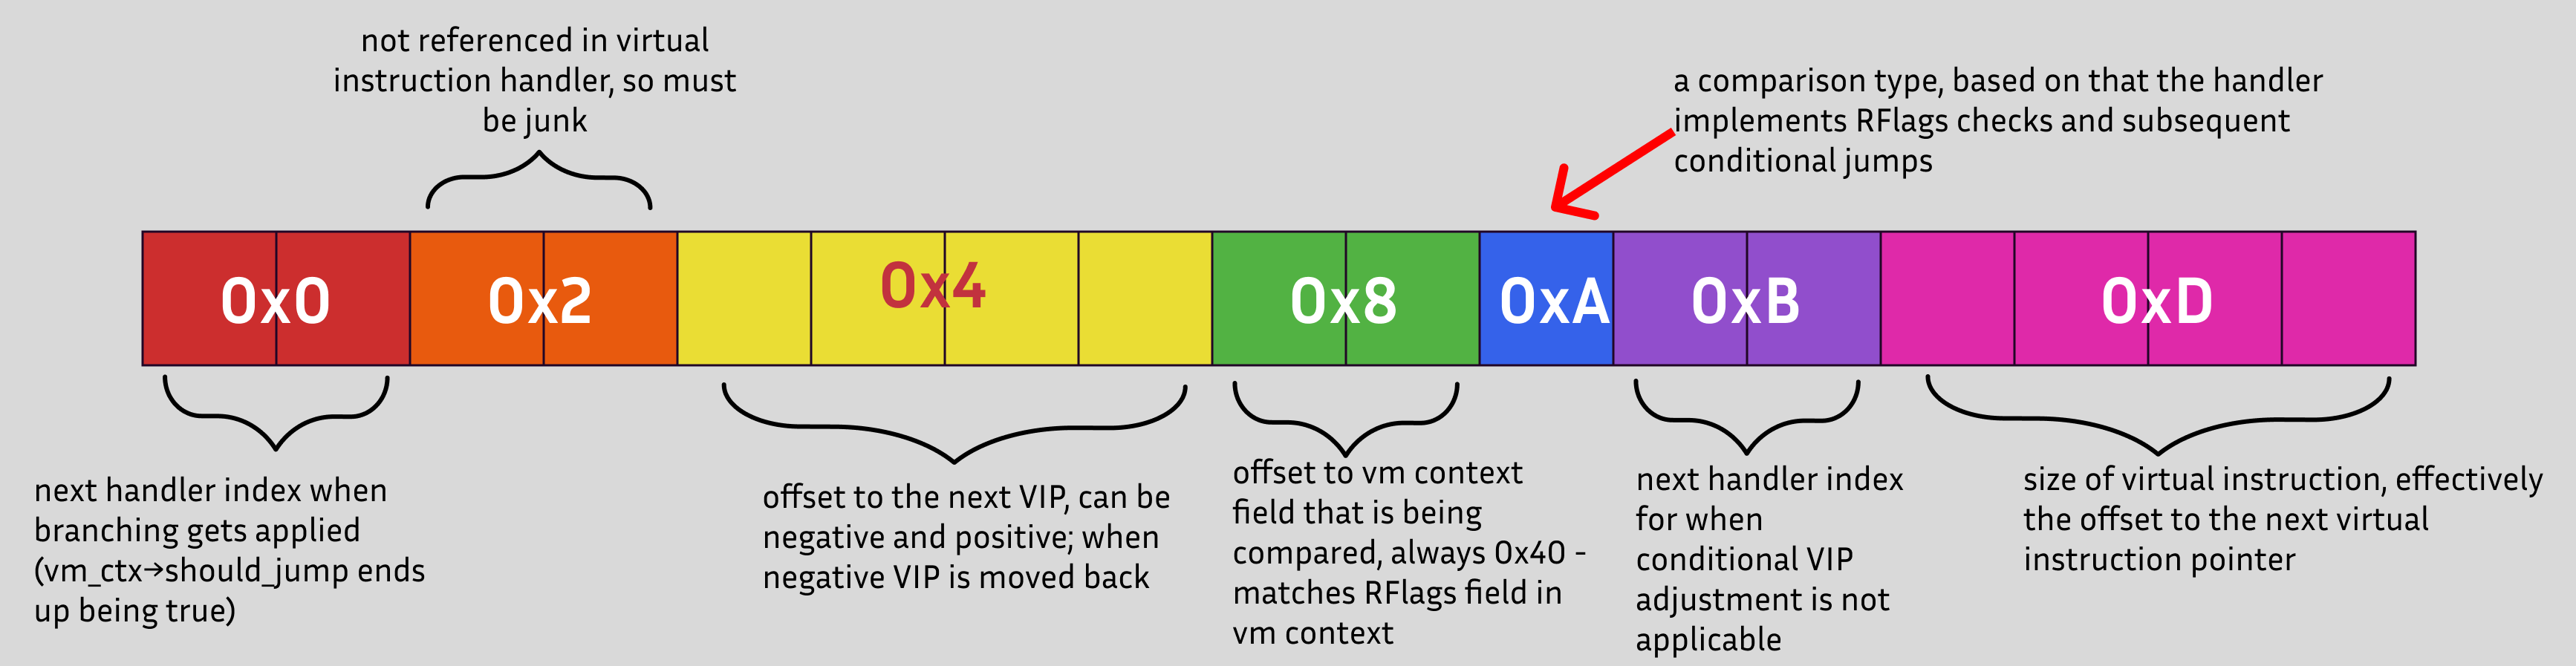
What this condition comes down to is a simple branch, we either go up or down. Here, as we can see, a new virtual context field appears – a bool at [vm_ctx+0xB2]. When this field is true, the next handler index is picked from the virtual instruction at 0x0 offset, then the VIP is adjusted by dword that is located at the 0x4 offset. The dword can be negative and in that case, the VIP will be moved back. Regardless of that, the jump is made to a handler that has an index of word ptr ds:[vip]. When the [vm_ctx+0xB2] bool is false though, the handler index is taken from [vip+0xB], and the VIP is increased by a dword from [vip+0xD].
At the top of the handler, we reset the 0xBA boolean field of the vm context, setting it to 0; then we read a qword field from the vm context at an offset retrieved from the virtual instruction (spoiler alert, the value is always 0x40, corresponding to our RFlags field), and then we read a byte from the virtual instruction of what appears to be the branching type.
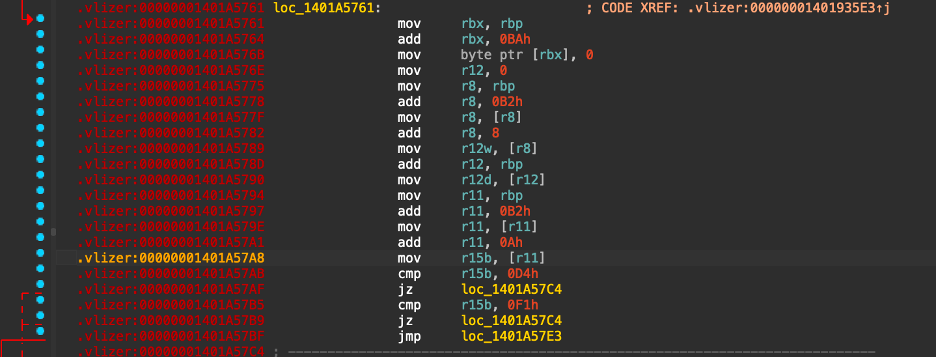
Then we have a bunch of checks against byte ptr ds:[vip+0xA], for example, when this value equals 0xD4 or 0xF1, it checks CF of RFlags, effectively implementing a JCC branch; when the value equals 0xEB, it checks OF and SF flags, effectively implementing JG branch, etc. But the flag comparison doesn’t result in direct jump right after, instead, a bool field of the vm context (at 0xBA) is set to true or false, depending on whether the condition for the jump was met. Let’s rename the 0xBA boolean in the vm context structure to something like should_jump.
To better understand the entire virtual instruction, I made this breakdown in Figma (sorry I never used it). Each square represents 1 byte or 8 bits.
Getting back to our interpreter, ideally, we don’t want to follow the exact same route as if we were tracing the app, and without actual tracing, we can’t really do it either. Since we want to map out the entire program behavior, we should follow all possible branch scenarios. The only thing is, we should avoid hitting an infinite loop, so let’s record jump destinations and interpret all following instructions, and once we reach the same flow (the exact same sequence of instructions) twice, we’re in a loop, so there’s no point in meeting this specific condition anymore, and we can abort the interpretation.
At this point, we could’ve made a profiler to convert virtual instruction bytecode to readable asm-like pseudocode, but there are two issues that make this approach less than perfect, especially for our case study. First, there are 650+ handlers in the virtual machine—yes, they’re all simple and predictable; however, disassembling 650 handlers to understand what kind of semantics they implement, in my opinion, is absolute madness. Second, Oreans products (Themida and Code Virtualizer) have over two dozen VMs, each with their own unique instruction set; in a real-world binary, we’ll need to somehow understand which VM of which Themida version was used, and then devirtualize it. There are still good approaches to “profile” any VM, but with this binary, our goal is to optimize as much as possible and not just understand the behavior of the virtualized code, although the latter is essential to what we’re trying to achieve.
Optimization
This is once again the point where we could’ve lifted the handlers to LLVM IR, then shrunk them by eliminating deadstores and optimizing memory access and recompiled them back. However, we can’t so let’s deal with optimizations manually.
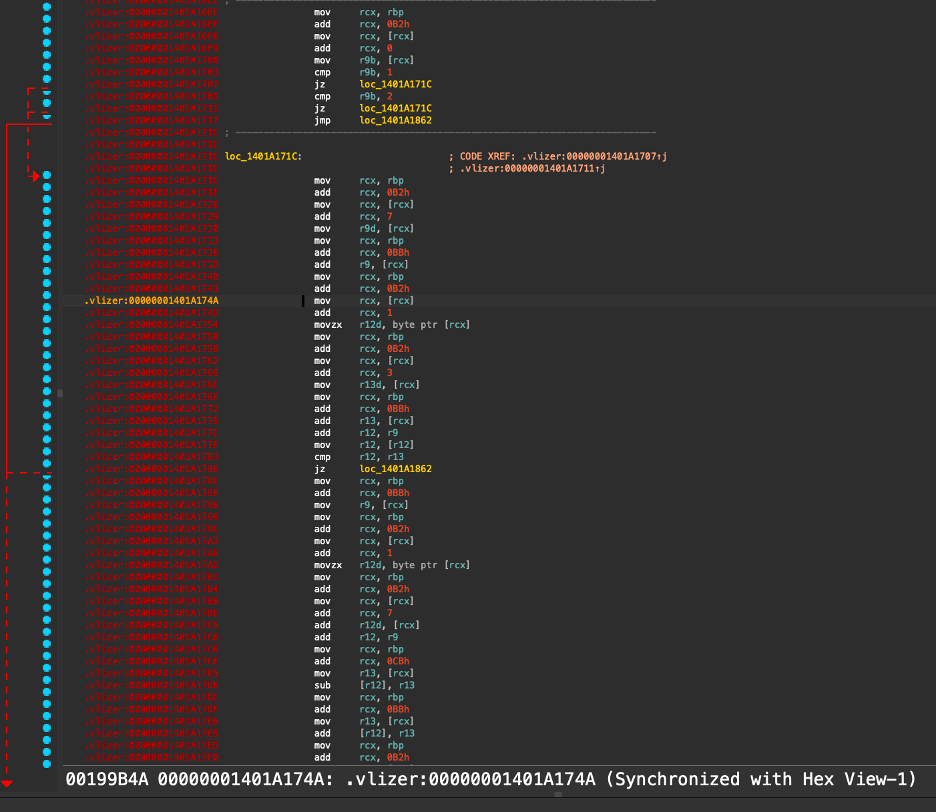
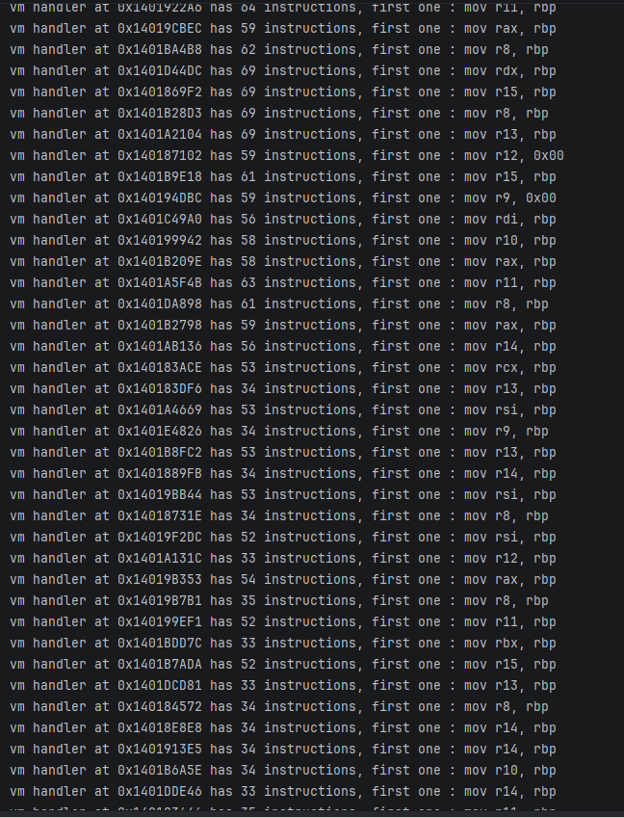
When the vm context pointer is moved to a register, usually all subsequent operations follow the initial mov {reg}, rbp instruction.
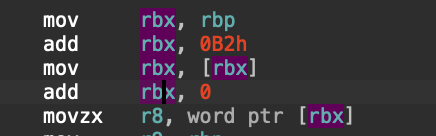
Preying on that, we can optimize these sequences by doing offset calculation and read in one-two operations. Moreover, instead of RBP, we can use a static pointer to our vm context since it’s essentially a global variable inside the VM section. But first, we need to test if this would work at scale, so let’s get back to the handler enumeration and analysis algorithm, and let’s try to find a simple pattern’s occurrences: mov {reg}, rbp; add {reg}, {imm} and then replace them with a direct pointer move. Then let’s try to patch these replaced entries and run our program!
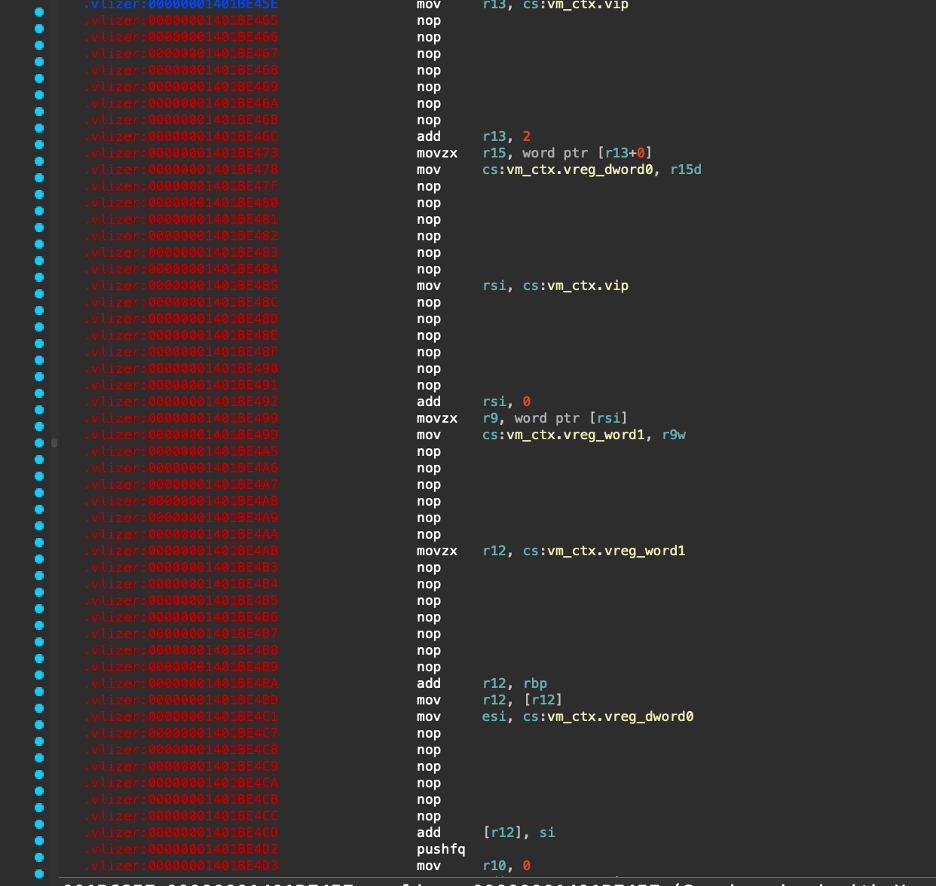
And this is how it looks like after optimizing all vm context reads and writes. And we can even see clean pseudocode. Let’s try to trace our now optimized app and compare the traces of original binary and our modified binary against each other.
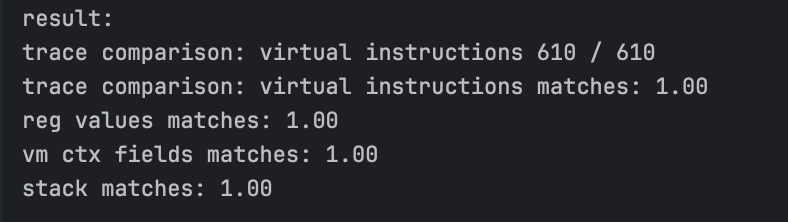
Beautiful! The exact same flow, the exact same values and pointers. Very good.
Frankenstein
Let’s get to the fun part. The optimization routine I made shrinks all access (reads and writes) of VM context fields, where it’s guaranteed that the registers are not reused, however, it doesn’t optimize the dispatcher chunk of VM handlers.
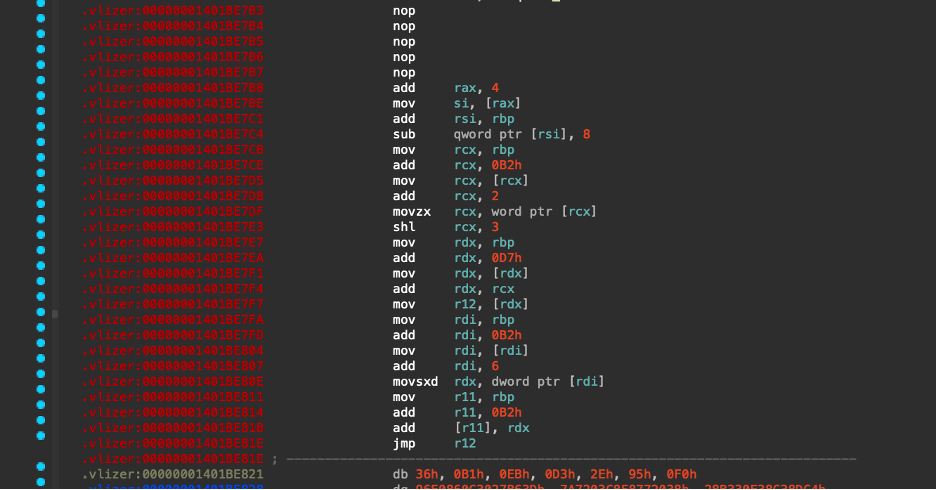
Is it on purpose???
Of course it is! Since we can reliably identify the dispatcher in every VM handler, we don’t need to optimize it. What can optimizing this part even bring us after all? We could probably rebuild the VM dispatcher loop to natively see which handlers are being called and match them against instructions, but that’s way too boring. What does a real hacker need? An IDA Pro and the F5 key, obviously. Legend has it, the more you press the F5, the more empowered you become. In Counter-Strike, the F5 community grew so large that they began selling their findings wrapped in the concept of so called p2c (pay to cheat), competing in an endless tournament of who can click F5 the fastest. You know the game osu? Same energy here, but with IDA. This is just amazing!
So what is this long preface doing here? Because now we’re going to strip the dispatchers from all of our handlers, and since we can interpret VM instructions at this point, we’ll stitch all the handlers together in the correct order so that our virtualized function becomes F5-able again.
Starting with virtual opcode reads in handlers, we need to identify exactly how those reads happen. When parsing the retrieval of virtual instruction opcodes, calculating the pointer to the virtual context’s VIP field and dereferencing it, a clear pattern emerges across all handlers: only two instructions are used to extract the virtual opcodes a handler needs, either mov or movzx. Both set a register’s value to something, so we can replace them all with mov, especially considering that movzx does exactly that, but reads from memory and zero-extends into the higher bits, which is essentially mov {reg}, {imm}.
Before reading actual opcode values, I decided to use static immediate values to see both how much we can optimize away, and whether my implementation of virtual opcode parsing correctly preserves operand size, since VM handlers can read all kinds of values from the virtual instruction, ranging from bytes to qwords.
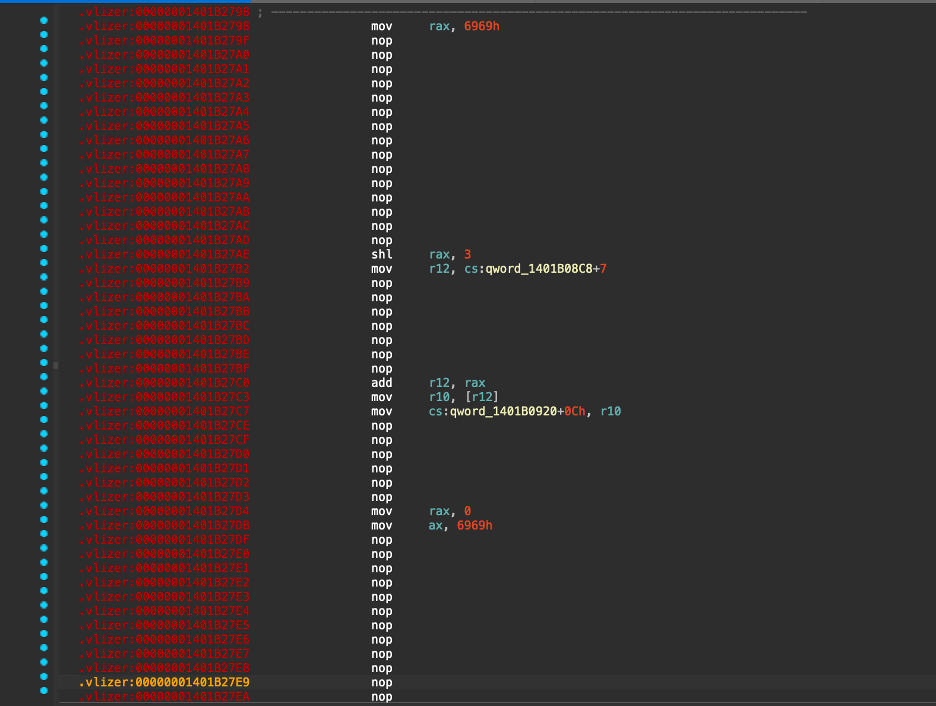
And it looks amazing! Our basic optimizations do trim quite a lot. It’s worth noting that, going forward, removing all NOP instructions would give us a cleaner overview; however, I won’t be doing this, because it would require analyzing branching within the handler to check whether any relative offsets need adjusting after removing the nop stubs. I’m too lazy to do that at this point, and it’s not important for our F5 goal anyway.
Moving on to branching, let’s rebuild the handler logic and simplify it. As discovered earlier, the conditional jump type is selected based on the type defined in the virtual instruction opcode. The vbranch handler in question implements exactly 16 conditional jump types.
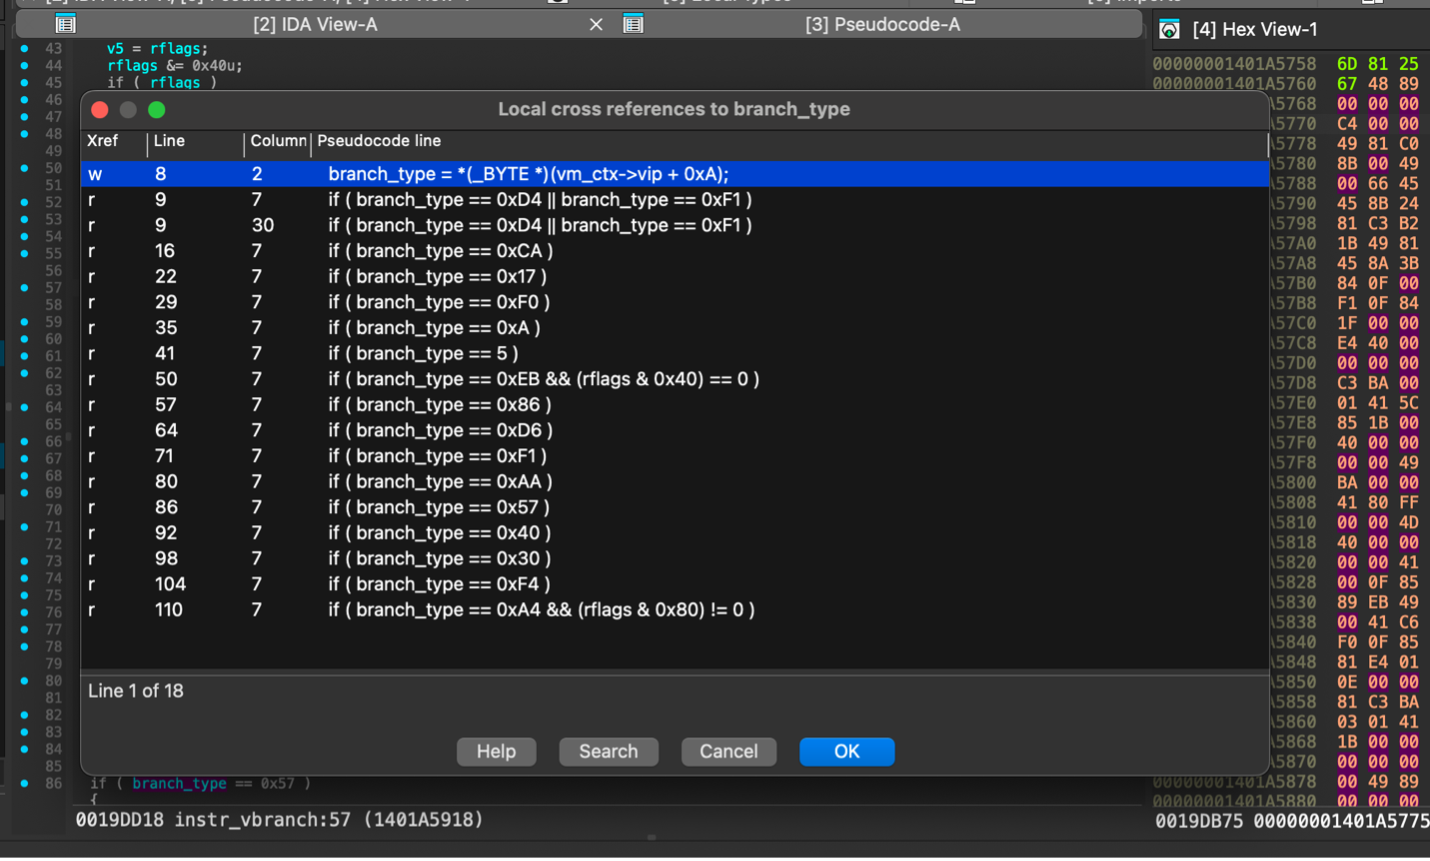
Let’s make a stub that we can assemble in real time once VBranch is reached, in that stub, we first need to set vm_context->should_branch to false, then pick the rflags register because 8th word in the virtual instruction always equals 0x40, which is an offset to the vm context’s RFlags field, and then, based on opcode at offset 0xA, decide what type of jump to apply. Here, there are two options, we can either look at the semantics and understand what kind of jump that is, or alternatively we can just compare RFlags against the values from original vbranch in a stub corresponding to this branching type, and then just do JNZ after CMP on vm_context->should branch (essentially just check if vm_context->should_branch is true and that the condition was met).
Now to the “lifting” itself. Instead of analyzing vpush/vpop sequences (which can absolutely be done), I decided to only devirtualize stubs between vm entries and their respective vm exits. This would give us the ability to actually spam F5 in between calls and see where each of those devirtualized chunks exit. Let’s give it a try and sew everything together with proper values.
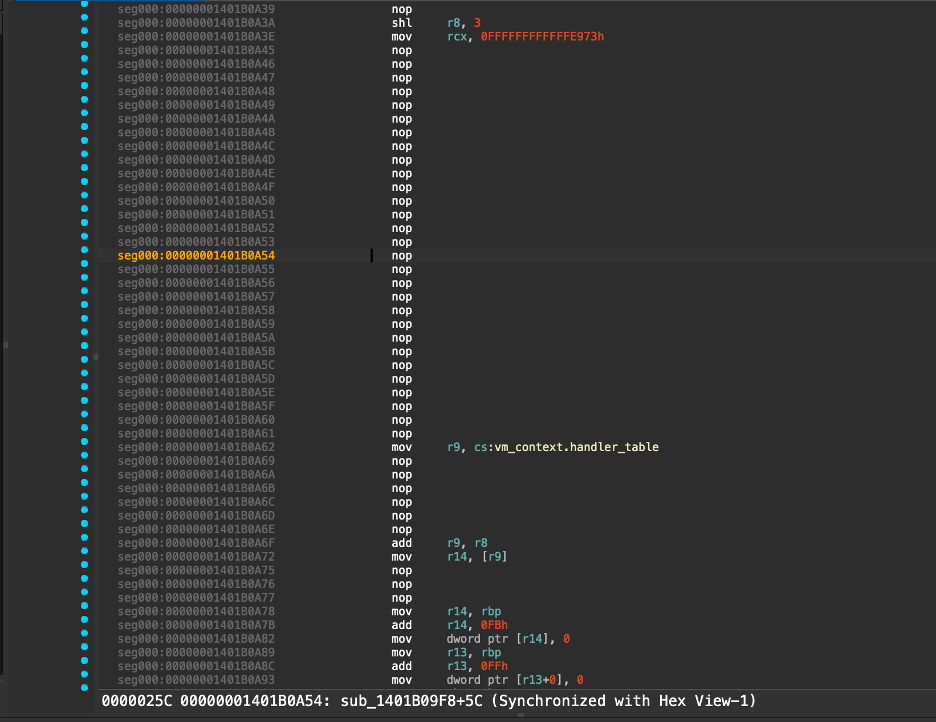
And this is the out put we get. Let’s look at pseudocode.
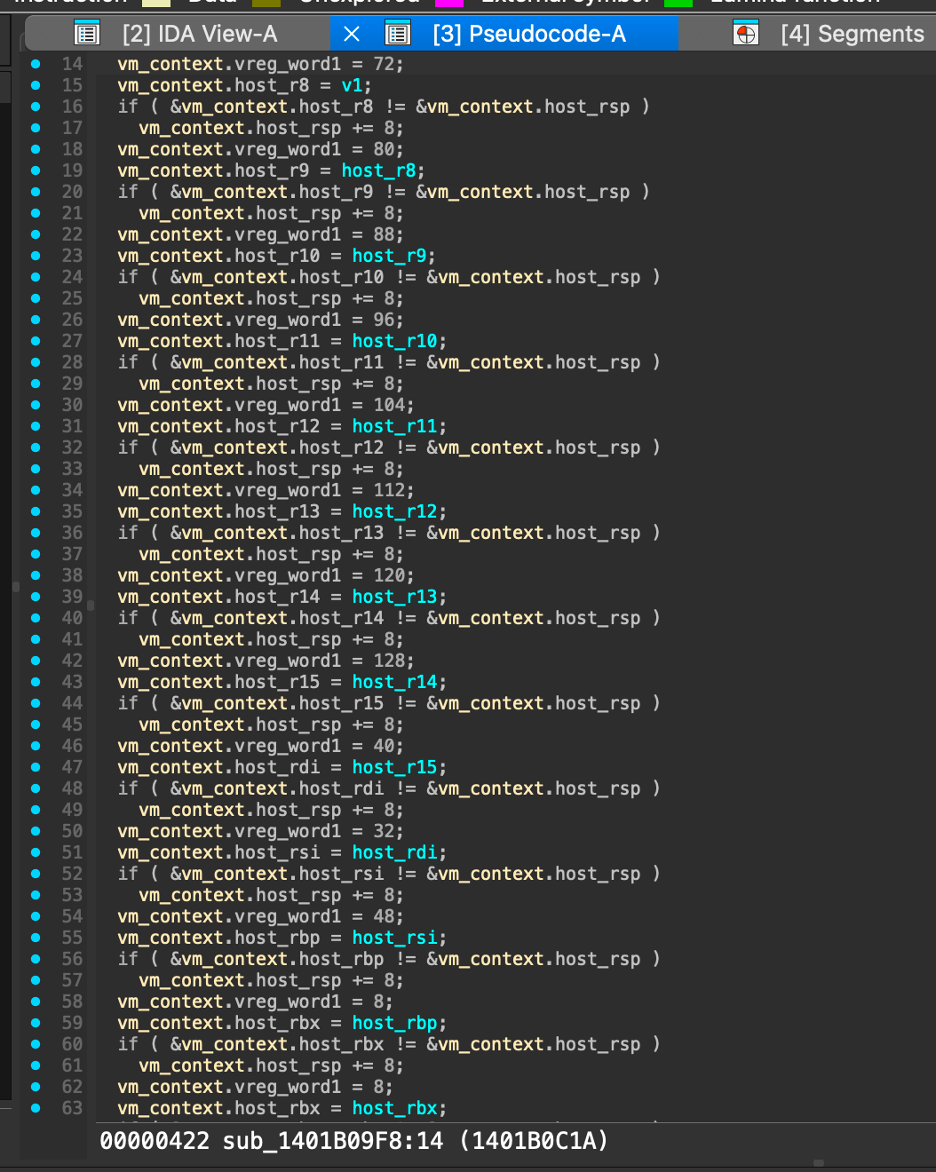
Here we can see the VPOP sequence after vm entry.
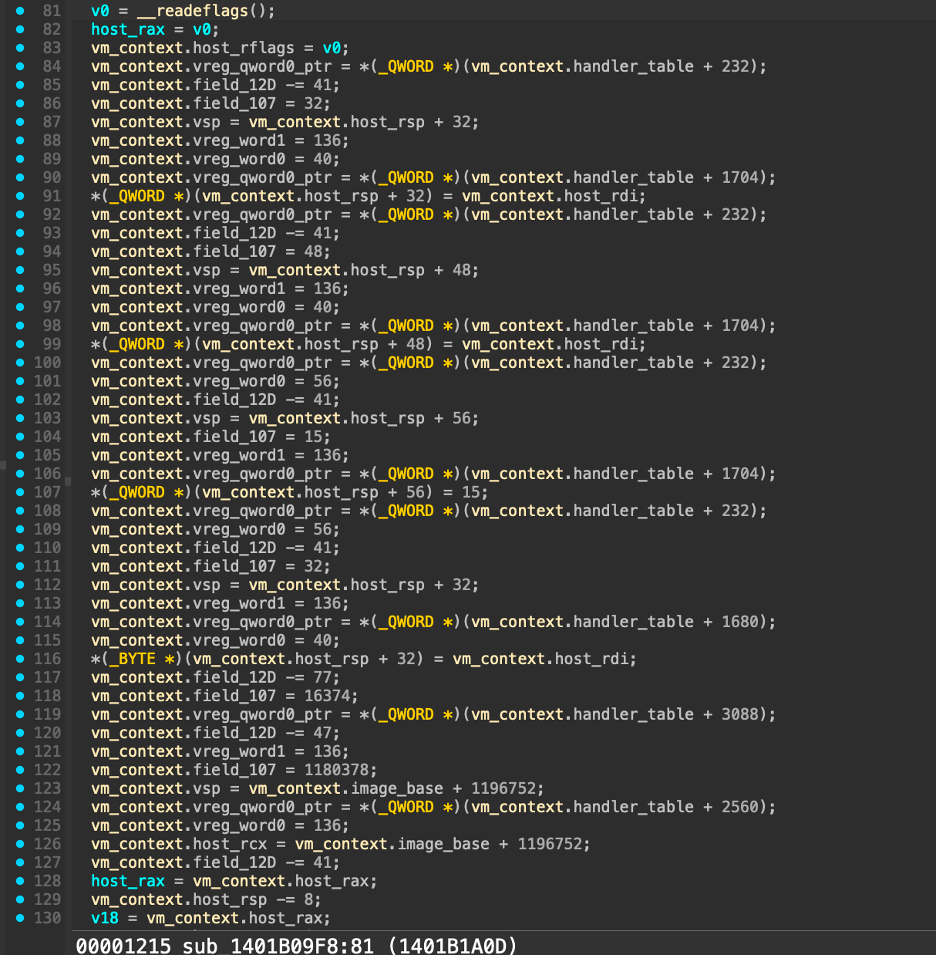
And here’s the chunk itself. I’ll add some comments to see what exactly this chunk is doing.
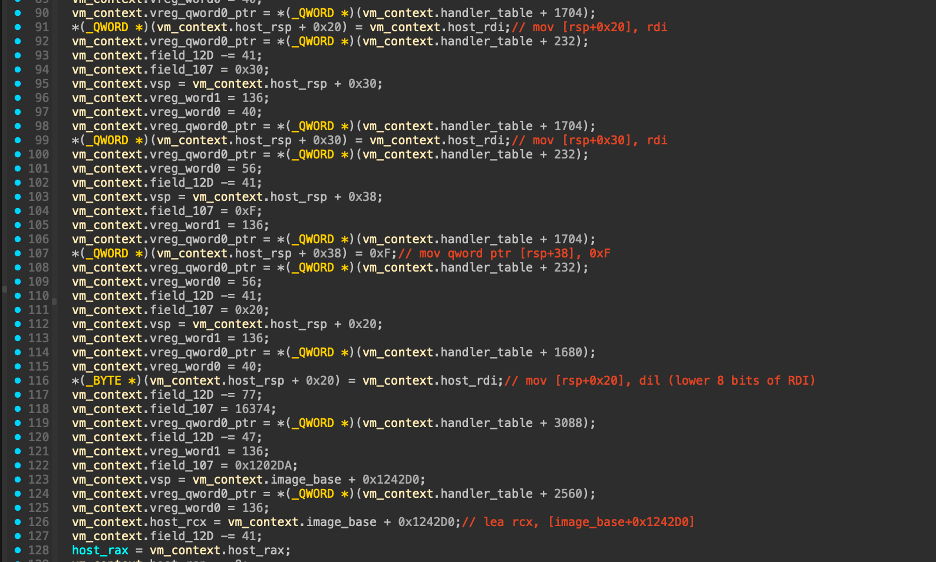

Okay, so as you can see, there’s some things left that can be optimized. For example the registers that are written but never read and remainings of handler table pointers reads from original handlers. It all can (and should) be stripped. However, we can already clearly see what’s happening inside the VM just pressing F5.
I think this counts as a success!
Conclusion
Themida is a great playground for (de)virtualization work, it implements all you want from a virtual machine, has code a mutation feature as well as anti debug stuff. Additionally, it’s pretty stable if we ignore potential concurrency issues caused by VMs being synchronous. However, it’s worth mentioning that Themida and Code Virtualizer (imo) fall behind their mainstream rival VMProtect.
What can be improved
From Oreans’ perspective, a lot of things require improvement. Let’s walk through ideas that can help improve obfuscation without losing speed and overall stability. The FALCON VM we analyzed is designed to be very efficient, so this is indeed a consideration.
1. Get rid of static VM context ptr register
Not only FALCON VM, but all VMs of Themida have the same basic problem: inside their VMs, the pointer to the current VM context is always stored in the RBP register. It’s extremely predictable and can be easily avoided; moreover, a register storing this pointer can be swapped mid-VM execution in heavier VMs, resulting in an even less trivial way of accessing the context.
2. Randomize bytecode
Right now, all VM bytecode is static and interpretable. We’re not in 2007; techniques like randomizing instructions, encrypting the data randomly, etc., are already widely adopted and have proven to be a great addition to security. Static bytecode creates a very huge possibility for the development of complete devirtualization tools with less effort than it would otherwise require, especially with modern-day AI.
3. Get rid of VM handlers table
This is not 2013; we’re past the VMProtect 2 era, where all handlers are stored in the protector’s section and are served on a silver platter within a dispatcher loop. Having all handler pointers stored together in one place, perfectly ordered, is honestly a crime against humanity at this point. The most obvious solution to get rid of the handlers table without significant VM architecture changes is to encode their addresses as opcodes of virtual instructions. For example, this VIP is adjusted by its virtual size, which doesn’t match the actual data being fetched from the instruction, meaning that at least virtual instructions are not subsequent (well, actually they are, but they have significant gaps between them, so it’s not a line-by-line read); the same can be done to VM handler pointers. Right now, each handler fetches the index of the next handler to call from its virtual instruction; instead of an index, it can read the encrypted next handler address.
Those are a few of the most obvious things I would implement if I were a Themida developer. Obviously, there’s much more left to be desired, and we can cover it separately by analyzing more complex Themida VMs!
Have you said thank you once?
Thanks for reading! Please subscribe and come to my next ted talk. We’ll either reverse engineer a binary with hardcore Themida/Code Virtualizer VM (like Eagle or Shark) protection applied in multiple instances. OR, we’ll take a look into the last version of VMProtect with virtualization, mutation and whatever else we can use to make our lives miserable!
And remember that you MUST NOT cheat in the videogames, or I’ll come and unlicense your pay to cheat application. Just kidding of course! :) Have a good time! Ciao